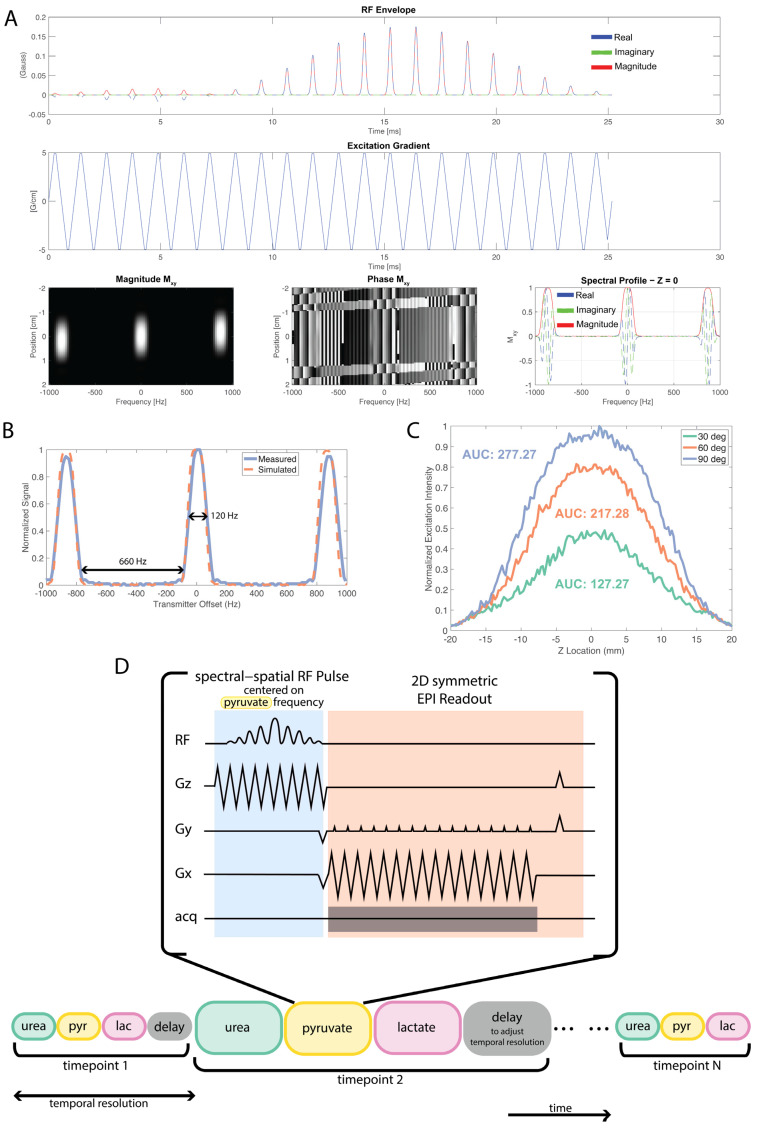
Figure 1.
EPI spectral-spatial RF pulse design. (A) RF pulse design using the SPSP RF pulse design toolbox [20]. (B) SPSP RF pulse frequency selectivity measurements were performed with a 4M 13C Urea sphere phantom. For this pulse, the measured passband had a FWHM of 120 Hz and stopband of 660 Hz. (C) Slice profile and corresponding area-under-the-curve (AUC) values for 30°, 60°, and 90° excitations. Corresponding FWHM values are 16.77 mm, 18.68 mm, and 20.10 mm, respectively. (D) During one timepoint, each metabolite is acquired using a spsp RF pulse with an EPI readout. Delay time is added at the end of a timepoint to achieve preferred temporal resolution.

