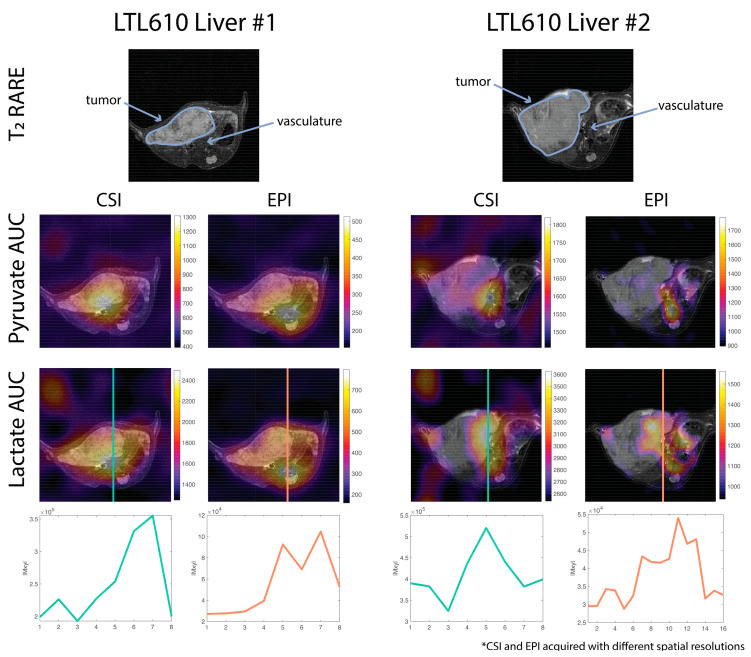
Figure 3.
In vivo pyruvate and lactate area-under-the-curve (AUC) maps of two mice overlaid on T2 RARE images. Both examples are of an LTL610 tumor implanted in the mouse liver. The EPI maps and lactate line profiles show two distinct signal peaks whereas the CSI maps have a single peak. The blurring of the vasculature signal due to the CSI PSF obscures lactate signal from the tumor. For both examples, CSI was acquired before EPI. See Figure S1 for dynamics of the CSI acquisition.

