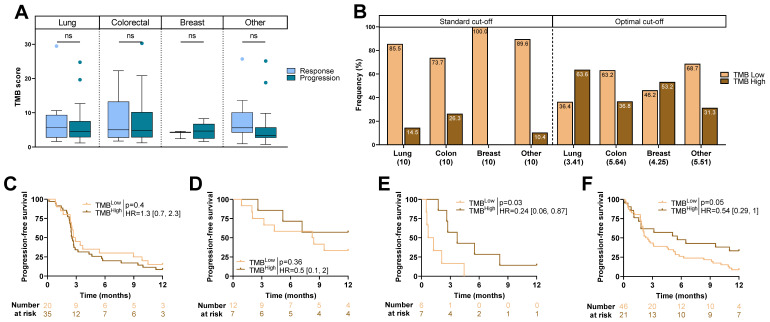
Figure 2.
TMB score and outcome: (A) Boxplots showing TMB score according to RECIST criteria for each cancer. (B) Barplots representing frequency of TMBHigh and TMBLow patients dichotomized according to the standard cut-off and optimal cut-off for each cancer (cut-off in brackets). (C–F) Kaplan–Meier curves with patients stratified according to TMB status (optimal cut-off) for progression-free survival for (C) non-small-cell lung cancer, (D) colorectal cancer, (E) breast cancer, and (F) other cancers. ns: not significant.

