An official website of the United States government
Here's how you know
Official websites use .gov
A
.gov website belongs to an official
government organization in the United States.
Secure .gov websites use HTTPS
A lock (
) or https:// means you've safely
connected to the .gov website. Share sensitive
information only on official, secure websites.

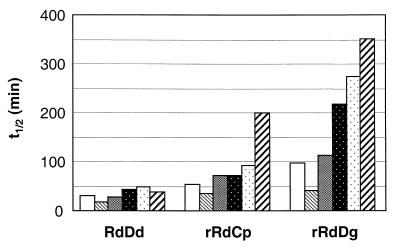
 , no additions and anaerobiosis;
  , no additions and oxygen-saturating conditions;
  , 200 mM glycerol;
  , 100 mM KPi;
  , 100 mM KPi plus 200 mM glycerol;
  , 100 mM DGP.