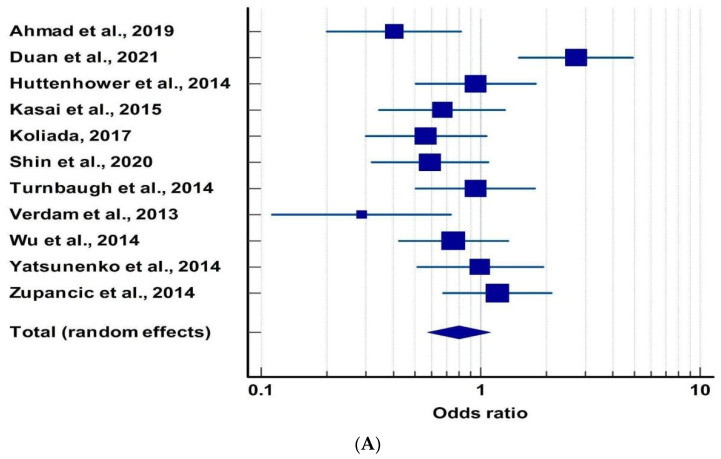
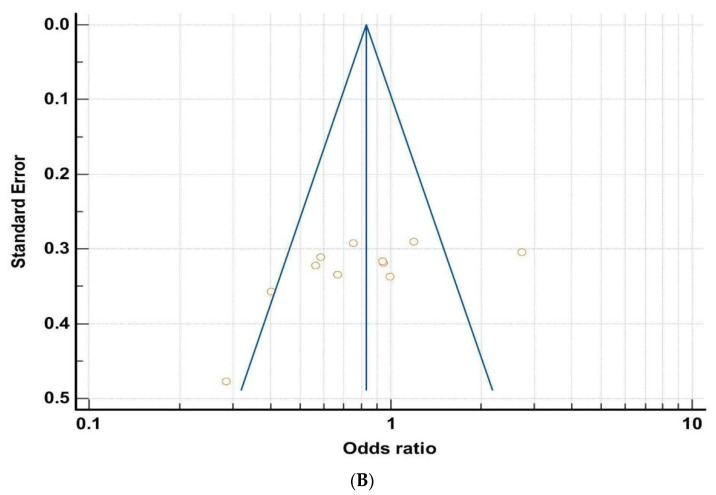
Figure 3.
(A) Forest plot between obesity and microbiota [56,57,58,59,60,61,62,63,64,65,66]. The box and the horizontal lines represent study specific OR and 95% CI, respectively. The size of the box is an indicator of the weightage of that particular study. Here, odds ratio less than 1 suggest the relative abundance of Firmicutes is higher in obese people. (B) Funnel plot of obesity and microbiota for publication bias.


