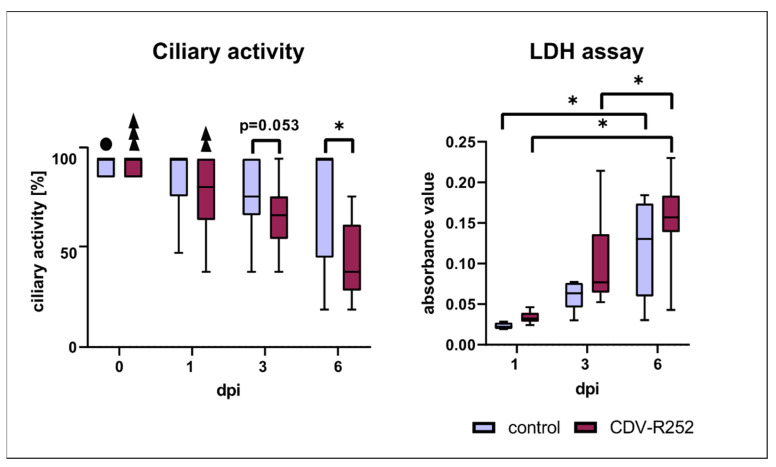
Figure 5.
Ciliary activity and lactate dehydrogenase (LDH) assay. Box and whisker plots show median and quartiles with maximum and minimum values. Significant changes are labelled by an asterisk. Black sphere: significant difference to control at 3 dpi; three superimposed triangles: significant difference to CDV-infected samples at 1, 3, and 6 dpi; two superimposed triangles: significant difference to CDV-infected samples at 3 and 6 dpi (p ≤ 0.05, Kruskal–Wallis H test).

