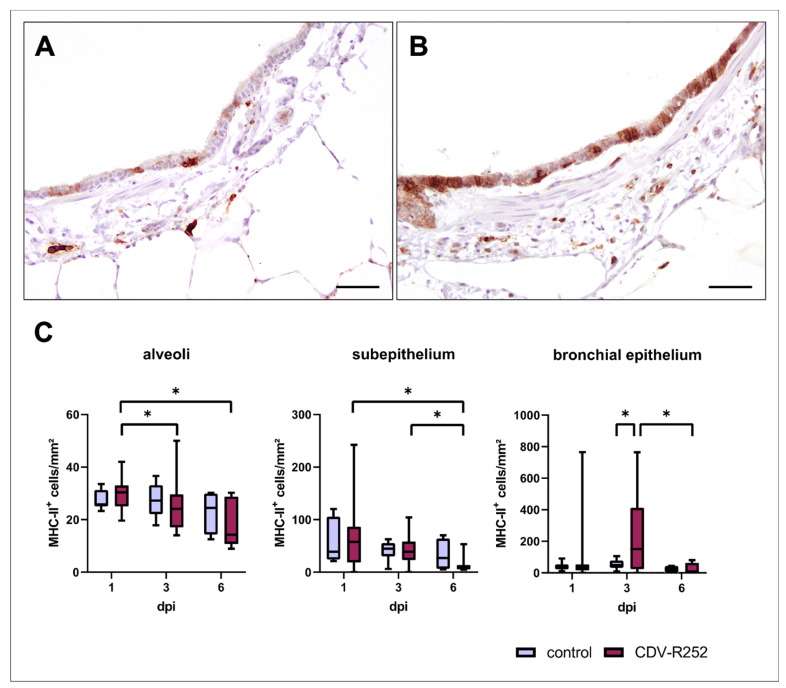
Figure 6.
Spatiotemporal quantification of MHC-II antigen expression in precision-cut lung slices (PCLSs). Representative images of an uninfected (A) and canine distemper virus (CDV)-infected (B) PCLS at day 3 postinfection. An increased MHC-II expression was observed in the bronchial epithelium of CDV-infected PCLSs at day 3 postinfection when compared to controls (C). Box and whisker plots show median and quartiles with maximum and minimum values. Significant changes are labelled by an asterisk (p ≤ 0.05, Kruskal–Wallis H test). dpi = days postinfection. Scale bars: 50 µm.

