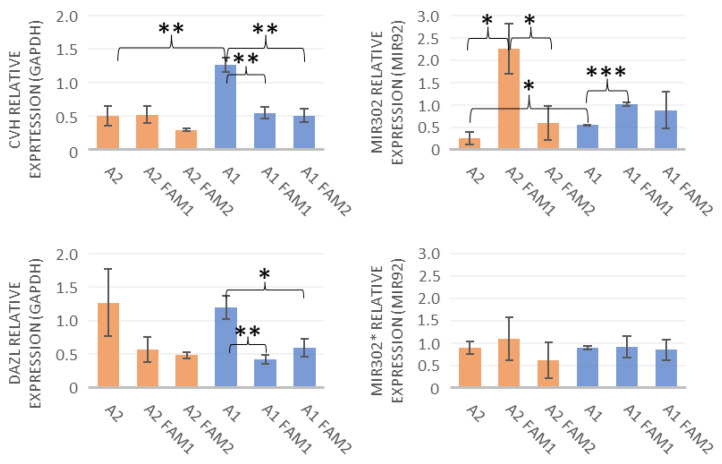
Figure 3.
The expression of CVH and DAZL was compared to the GAPDH control level. The data labeled with the cell line names (A1, A2) show the BF results, and the FAM1 and FAM2 data present the data from after freezing. The results were analyzed via the GenEX software and showed multiple significant data. The most interesting observation was the reduction in CVH expression in the male line after freezing. It seems that in male PGCs, the cryopreservation lowered the CVH expression to a level equal to the female BF expression rate. * p < 0.05, ** p < 0.01, and *** p < 0.001.

