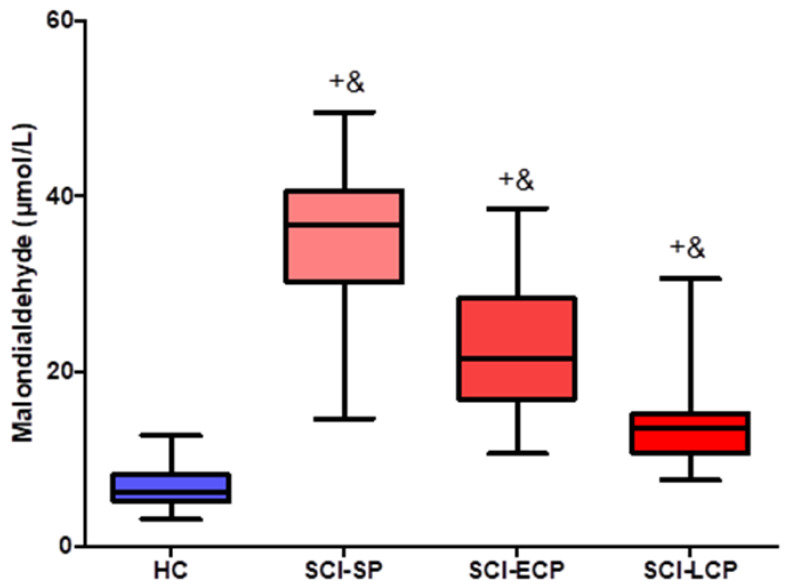
Figure 1.
Boxplots of MDA concentrations according to healthy controls and different groups of patients with spinal cord injury. Data for plasma MDA levels are presented as median (horizontal black line inside) with interquartile range (IQR). HC, healthy controls (N = 38); SCI SP, short period (time of evolution less than 5 years) (N = 31); SCI ECP, early chronic (time of evolution 5–15 years) (N = 32); SCI LCP, late chronic (time of evolution more than 15 years) (N = 42). HC vs. SCI-SP = + = *** p < 0.0001; HC vs. SCI-ECP = + = *** p < 0.0001; HC vs. SCI-LCP = + = *** p < 0.0001; SCI-SP vs. SCI-ECP = & = *** p < 0.0001; SCI-ECP vs. SCI-LCP = & = *** p < 0.0001; SCI-SP vs. SCI-LCP = & = *** p < 0.0001; Mann–Whitney U-tests.

