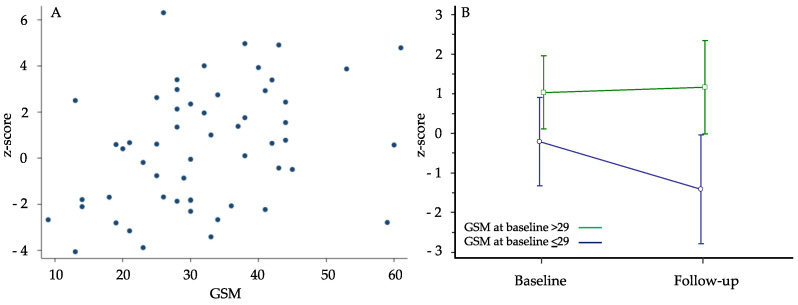
Figure 2.
Panel (A) Spearman’s correlation between gray-scale median (GSM) and z-score at follow-up (rho: 0.392; p = 0.003). Panel (B) variation of composite z-score in 2 groups of participants distinguished on the basis of the median GSM value of 29 assessed at first examination (two-factor analysis of variance—ANOVA with repeated measures over time).

