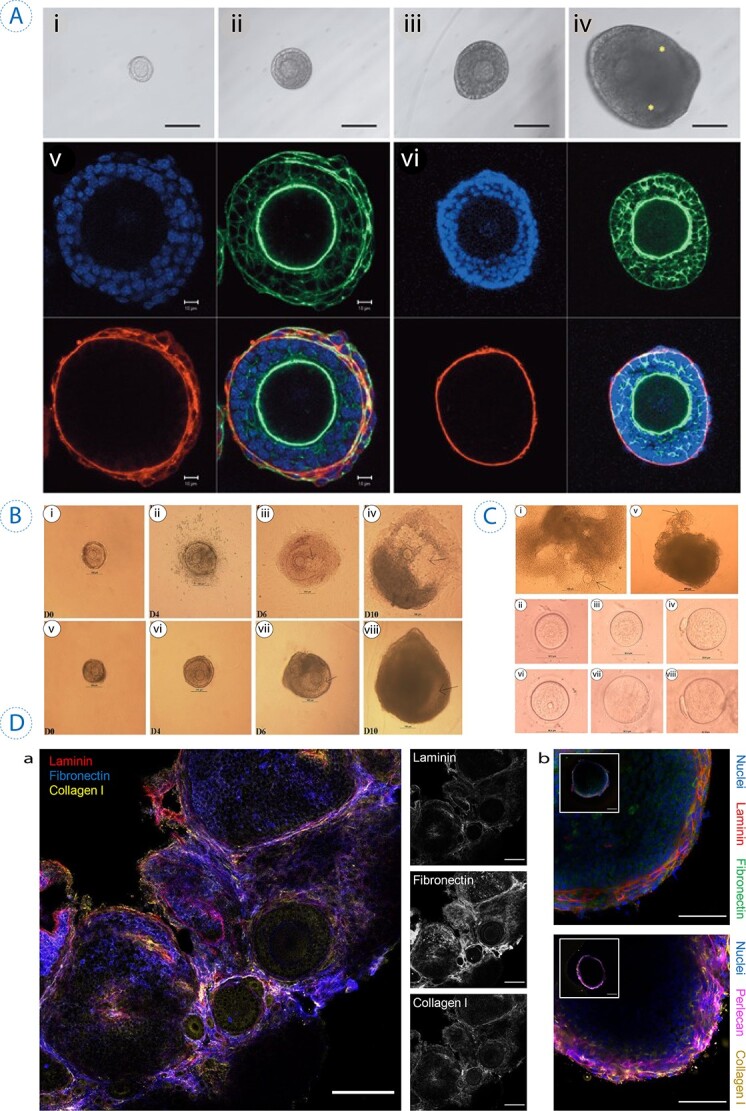
Figure 2.

Several hydrogels applied to provide a suitable environment for in vitro folliculogenesis/oogenesis. (A) Survival of primary follicle cultured with ascorbic acid on days 0, 6, 10, and 16 (i–iv). Confocal images illustrate the growth of the follicle cultured in the presence of ascorbic acid after 6 days (v) and the control secondary follicle (vi) (staining represents red for laminin, green for f-actin, and blue for nucleus). It was observed that the survival rate increased by ascorbic acid, and primary follicles reached a diameter of around 250 μm. The scale bars: 100 μm for i–iv and 10 μm for iv. Reprinted with permission from Tagler et al. (52). (B) Morphological changes of rat follicle in the 2D (i–iv) and 3D (v–viii) in vitro growth (IVG). In both cultures at day 0, immature oocytes were observed at the center (i, v); however, the difference is distinguishable later as the follicles started to collapse in 2D (ii) compared with well-maintained follicles in 3D alginate bead (vi). During 10 days of culture, there were a few antrum-like cavities in 2D-cultured follicles (ii, iv), although in 3D condition, follicles were observed larger forming antrum-like cavities (vii, viii). (C) The IVG of rat oocytes in 2D (i–iv) and the 3D (v–viii) culture conditions. The release of COCs from follicles is shown by arrows (i, v), 20 h after exposure to hCG and EGF to induce ovulation. Germinal vesicles were detected in both of the cultures (ii, vi) and oocyte transition from a Germinal Vesicle (GV) to Germinal vesicle breakdown (GVBD) (iii, vii). Meiosis also continued as the mature oocytes released the first polar body (PB) (iv–viii). Reprinted with permission from Zhang et al. (58). (D) The ECM proteins and distribution visualized by a fluorescent microscope in ovarian tissue and antral follicles. (a) Staining represents blue for fibronectin and yellow for collagen I, throughout the stroma and within ovarian follicles, while laminin (in red) is only observed in the perifollicular space. Scale bars = 100 μm. (b) Staining represents green for fibronectin and yellow for collagen I, the granulosa cell layers of antral follicles isolated from ovarian tissue, but laminin (in red) and perlecan (in magenta) are detected in theca layers. Scale bars = 50 μm and 100 μm (inset). Reprinted with permission from Tomaszewski et al. (65).
