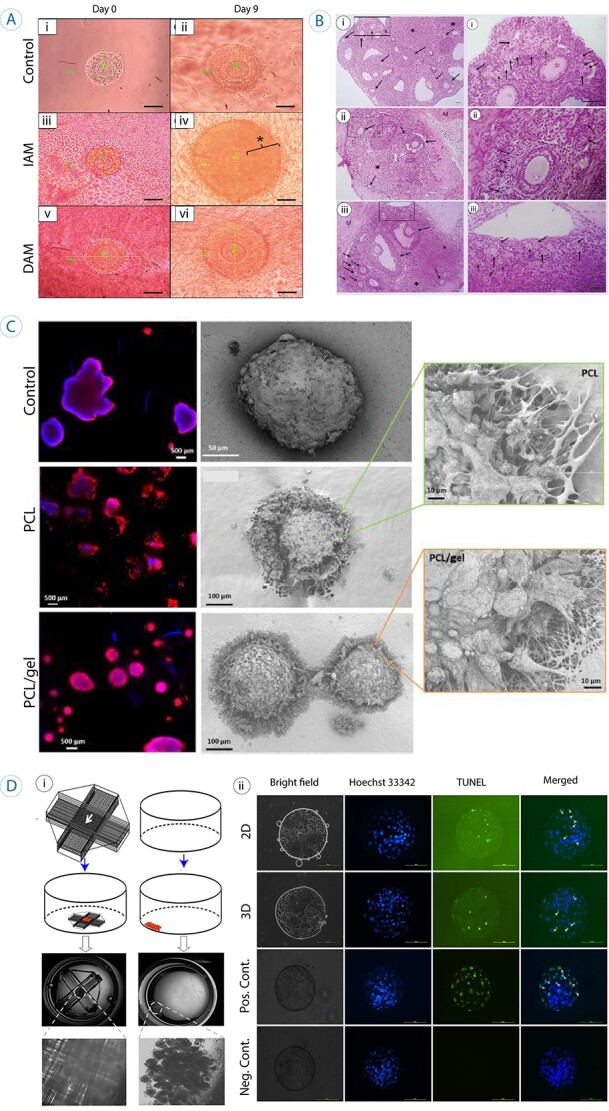
Figure 3.

3D scaffolds used in supporting folliculogenesis and oogenesis. (A) In vitro culture of the primary follicle after 9 days on a decellularized scaffold. The control culture was in base medium, IAM on intact human amniotic membrane and DAM group represents the ones cultured on decellularized human amniotic membrane. Star represents hyperproliferation that occurred for granulosa cells in primary follicles cultured on IAM. Scale bar =50 μm. Reprinted with permission from Motamed et al. (103). (B) The histological sections of autotransplanted ovarian grafts in mice after 28 days (arrows show follicles). (i) Control group (mice without ovariectomy or grafting), (ii) autografted group which is detected by fewer follicles, (iii) autografted + platelet-rich fibrin bioscaffold group, which exhibited a significantly higher number of follicles. Scale bar: 100 μm. M: Muscle. Reprinted with permission from Shojafar et al. (110). (C) Porcine follicles seeded on electrospun PCL fibers, PCL/gel, and control (PET membrane) illustrated by fluorescence microscope (actin in red and nucleus in blue) and SEM images 10 days post-seeding. SEM micrographs with higher magnifications represented interaction between follicles and scaffolds, as no adhesion spots were observed for the control. Reprinted with permission from Liverani et al. (118). (D) i, The schematic represents the fabricated 3D glass scaffold and 2D culture methods. ii, Hoechst 33342 staining showed the total number of cells, and TUNEL assay exhibited apoptotic cells (the arrows point to TUNEL-positive nuclei). Reprinted with permission from Shen et al. (119).
