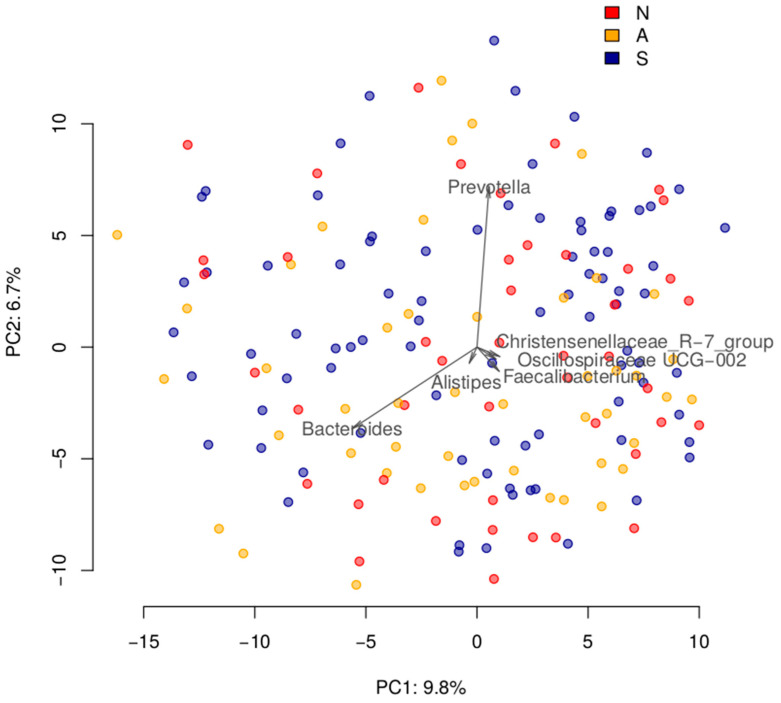
Figure 1.
Overall comparison of post-COVID gut microbiomes across the three groups of patients with different courses of infection. The samples are visualized using Principal Coordinates Analysis (PCoA) based on the Aitchison distance. Arrows show the top taxa in terms of the explained variance in given axes, with the length proportional to the variance explained by the taxon. The arrows’ angle reflects the distribution of variance between the axes. N—non-infected group, A—asymptomatic group, S—severe group.

