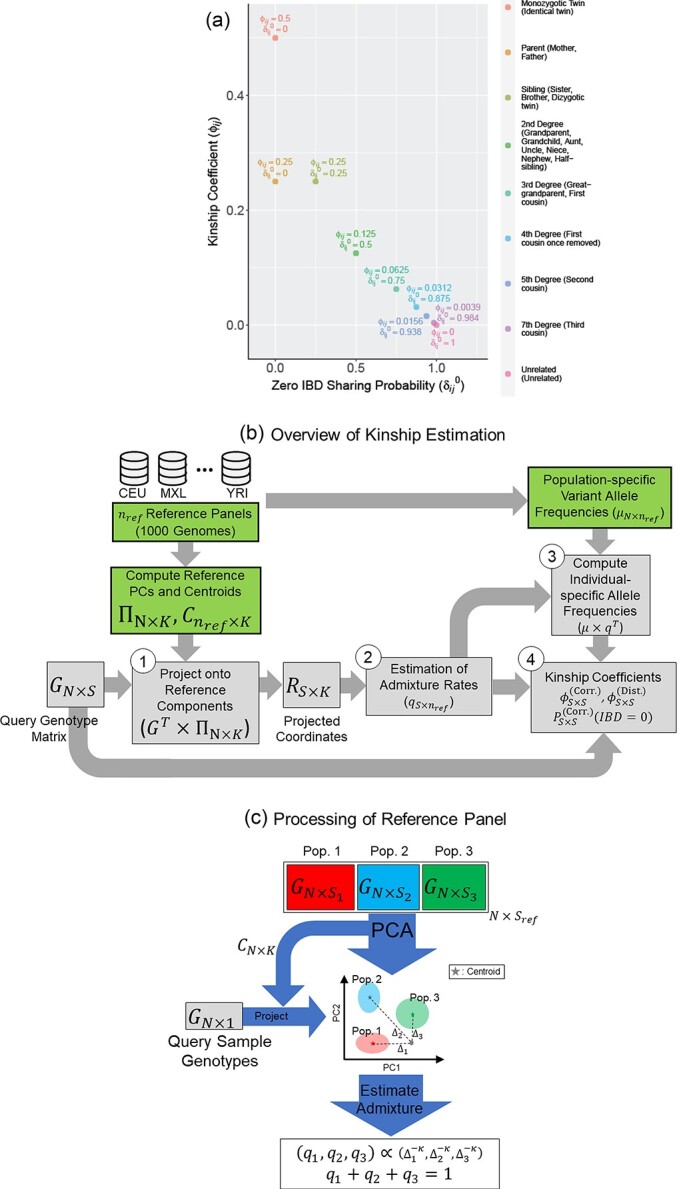
Figure 1.

Illustration of the kinship estimation. (A) The expected values of kinship coefficient ( ) and probability of zero-IBD sharing (
 ) for relatives with varying degrees of relatedness. Each dot corresponds to a relationship. The expected values of
  and
and  are shown on y- and x-axis, respectively, for each relatedness level. (B)
  reference population panels are used for computing the principal components (
 ) and the population-specific centroid coordinates
  . Given the query genotype matrix,
  , they are first projected onto
  reference panel components, where the projected coordinates are stored in
  . The admixture rates are computed by comparing the population-specific centroids to the projected coordinates. The estimated admixture rates are used to compute individual-specific allele frequencies for each of the
  variants for each of the
  individuals in the query genotype matrix. The individual-specific allele frequencies are used in the estimation of the correlation and distance-based kinship coefficients and IBD-sharing probabilities. (C) Illustration of decomposition and projection of a query individual. The pooled reference genotype matrix is by PCA and projected on the top two components for the three reference populations. The centroids of each population are identified as the mean projected coordinates for individuals in the respective population. The query individual is projected onto the two components and distance of the projection to the three centroids is used to estimate admixture rates for this individual. It should be noted that two components are used for illustration purposes, the number of components that SIGFRIED uses can be changed by the user.
