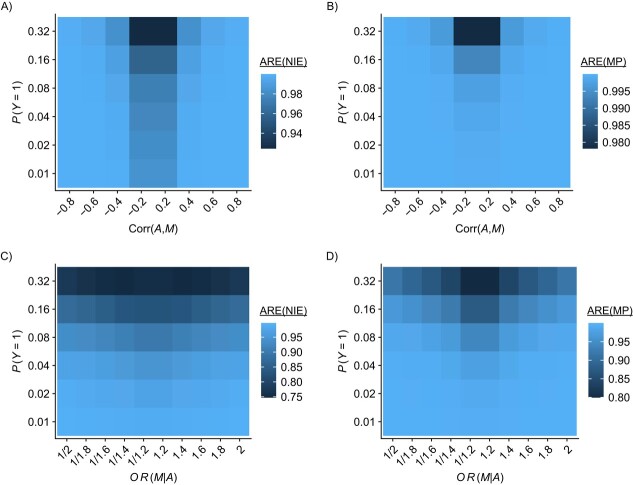
Figure 2.
Heat maps of the asymptotic relative efficiencies (AREs) for natural indirect effect (NIE) and mediation proportion (MP) estimators under different levels of the outcome prevalence ( ) and the exposure-mediator association (
 or
or  ). The ARE value in each pixel is the average of the AREs among all scenarios considered with the outcome prevalence and exposure-mediator association given. A) ARE for the NIE estimator (ARE(NIE)) in case
  ; B) ARE for the MP estimator (ARE(MP)) in case
  ; C) ARE for the NIE estimator (ARE(NIE)) in case
  ; D) ARE for the MP estimator (ARE(MP)) in case
  . OR, odds ratio.

