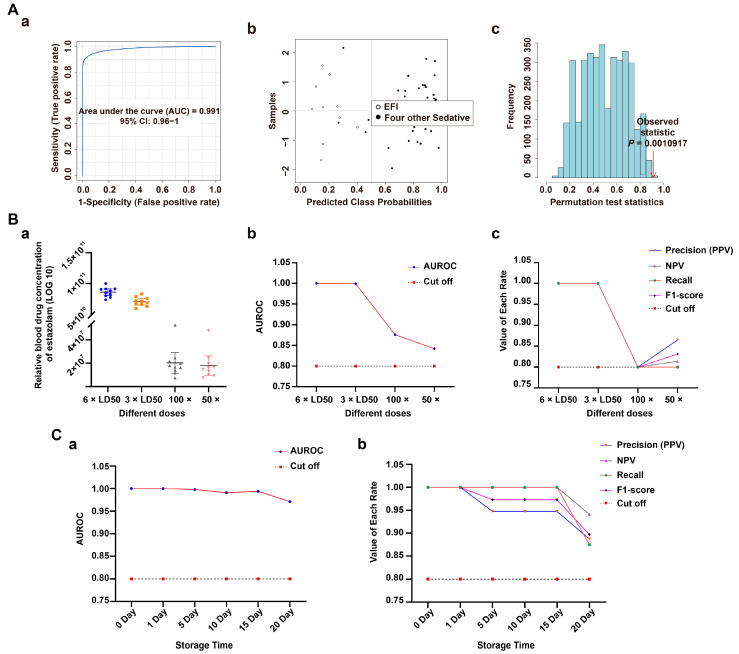
Figure 4.
Validation of classification model in plasma samples. (A) Specificity evaluation of the EFI classification model relative to four other sedative-hypnotic drugs’ fatal intoxication models (zaleplon, diazepam, nitrazepam and sodium pentobarbital, nanimal = 10, respectively): (a) ROC plot: AUC = 0.991 (95% CI: 0.96−1); (b) confusion matrix plot showing samples with few misclassifications; (c) classification model with 100 permutation-test plots, p < 0.01. (B) Sensitivity evaluation of the EFI classification model relative to other different dose groups of estazolam (3 × LD50, 100 × and 50 × therapeutic dose groups, nanimal = 10, respectively.): (a) Relative plasma concentration of estazolam (LOG10) in different dose groups. The blue circles, orange squares, gray and pink triangles in the plot represent the relative blood drug concentrations of estazolam in their groups, respectively. (b) line plot of AUC-value, cutoff = 0.8; (c) line plot of the Precision (PPV), NPV, Recall and F1-score, cutoff = 0.8. (C) Classification model stability evaluation over time (0, 1, 5, 10, 15, and 20 days) in EFI (nanimal = 8) and NDRDs (CD, DR, MA. nanimal = 6, respectively). Line plot of AUR-value: (a) Precision (PPV), NPV, Recall and F1-score value (b) over time, cut-off = 0.8. Notes: Precision (PPV) = tp/(tp + fp); NPV = tn/(tn + fn); Recall = tp/(tp + fn); F1-score = 2 × PRE × REC/(PRE + REC); tp: total number of true positive samples; tn: total number of true negative samples, fp: Total number of false positive samples, fn: Total number of false negative samples. Because the number of EFI groups differed significantly from each control group, the above rates were calculated by weighting. Abbreviations: PPV: positive predictive value, NPV: negative predictive value, precision: PRE, recall: REC.

