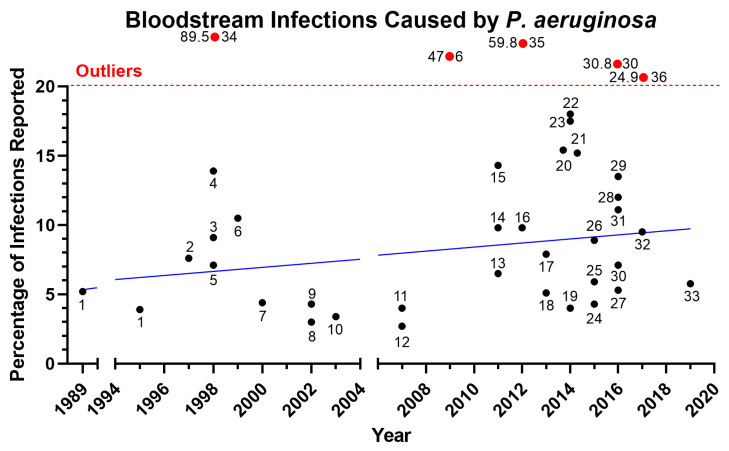
Figure 3.
Rates for bloodstream infections caused by P. aeruginosa in hospitalized patients over the past 3 decades (1989–2019). Hospital-acquired infections included bloodstream infections and catheter-associated bloodstream infections, catheter-associated urinary tract infection, surgical site infections and burn wound infections, and hospital-associated and ventilator-associated pneumonia; although not every article reported every category, most included at least three. Each circle represents the rate reported in the study, and the year corresponds to the last collection date of the data. The solid blue line represents the linear regression of the infection rate over the years excluding outliers, which are shown above the dotted red line. The numbers associated with the black circles indicate reference numbers; the numbers to the left of the red circles are the percentages, and those to the right are the reference numbers. References: 1. [5], 2. [39], 3. [22], 4. [19], 5. [40], 6. [41], 7. [42], 8. [43], 9. [3], 10. [7], 11. [44], 12. [45], 13. [46], 14. [47], 15. [48], 16. [49], 17. [50], 18. [51], 19. [10], 20. [52], 21. [11], 22. [53], 23. [54], 24. [55], 25. [56], 26. [57], 27. [58], 28. [59], 29. [60], 30. [61], 31. [16], 32. [17], 33. [8]. Outliers: 34. [62], 35. [21], 36. [63].

