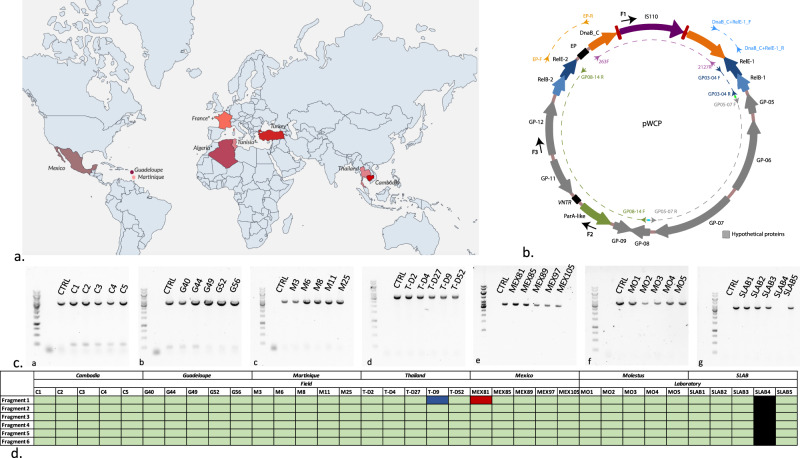
Fig. 1. pWCP distribution and sequence variability.
a Geographic map with locations of Culex sample collection for pWCP screening. Colors indicate field samples with different color for each country sampled. A “+” indicates laboratory specimen and “*” indicates previous observations from [14]. b Map of pWCP plasmid (adapted from [14]). Genes are shown as filled arrows. Couples of PCR primers spanning different regions of the plasmid designed to cover pWCP are shown as smaller arrows. Dash lines indicate amplified fragments (Purple: Fragment 1; Dark blue: Fragment 2; Gray: Fragment 3; Green: Fragment 4; Orange: Fragment 5; Light blue: Fragment 6). Bright green and blue dots indicate overlapping primers as highlighted in Supplementary Table 2. Additional sequencing primers are shown in black arrows on the outer layer. c PCR amplification of the largest and most representative for plasmid genetic diversity Fragment 4 in studied samples. A ca. 3451 bp PCR product corresponding to the amplification of Fragment 4 including seven genes of pWCP (GP08, GP09, ParA-like, VNTR, GP11, GP12 and RelBE-2) in most ovary samples collected from different regions. a: Cambodia, b: Guadeloupe, c: Martinique, d: Thailand, e: Mexico, d: Montpellier (molestus) and f: SLAB. The first raw of each gel is the negative CTRL. d Synthetic heatmap of conserved pWCP fragments across samples. pWCP fragments 1–6 are shown in row and studied samples in column. Green color indicates fragment of the right size, blue if longer, red if shorter. Black corresponds to Wolbachia-free sample.

