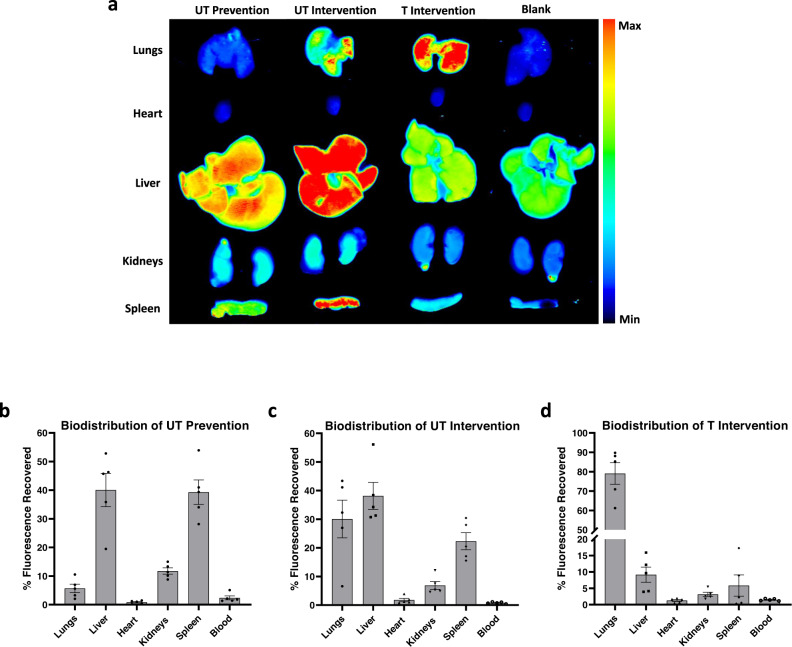
Fig. 5. Biodistribution of particles in treated mice.
a Representative scans of organs treated with particles (‘Untargeted (UT) prevention,’ ‘UT intervention,’ and ‘Targeted (T) intervention’) and untreated (‘Blank’) mice using an Odyssey CLx Infrared Imaging System three hours after treatment with LPS. Quantified results of recovered fluorescence in each organ (percent of total fluorescence recovered from all organs) for mice receiving (b) UT prevention, (c) UT intervention, and (d) T intervention treatments. Experimental groups consist of N = 5 mice per group. Circles represent individual data points, bar graph represents the average of individual data points, and error bars represent standard error. Source data are provided as a Source Data file.

