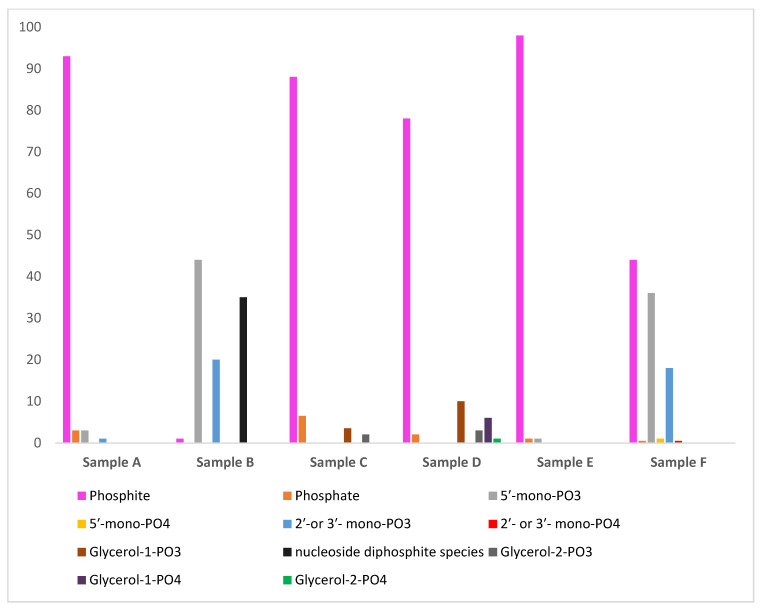
Figure 6.
The relative abundances (%) of the phosphonylated and phosphorylated as well as amount of inorganic phosphate (oxidation product of phosphite) observed in each sample. Where Samples B, D, and F where with urea as an additive, and Samples A, C, and E were without urea. The relative abundances (%) were calculated using the peak integration method of 31P-NMR [24,25,26].

