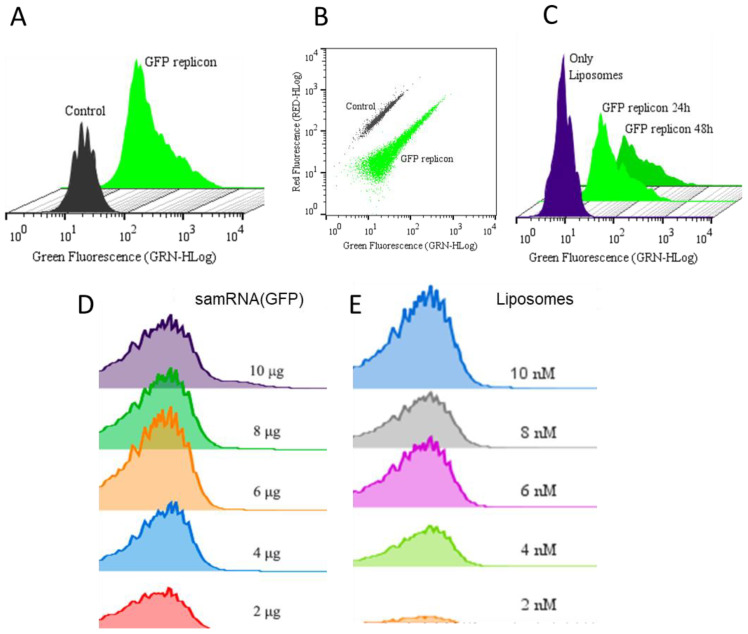
Figure 4.
Comparison of samRNA or lipid composition quantities in transgene expression in vitro. (A) Representative histograms of Vero cells expressing GFP 24 h after transfection with the GFP-expressing replicon in comparison to an untransfected control. (B) Dot plot comparing the populations described in (A). (C) Representative histograms of GFP expression 24 h and 48 h after transfection with samRNA encoding GFP encapsulated in liposomes in comparison to a control transfected with empty liposomes. (D) Representative histograms of GFP expression dependent on the amount of transfected replicon (2 μg, 4 μg, 6 μg, 8 μg or 10 μg of transfected replicons) in HEK293T cells 24 h after transfection. (E) Representative histograms of GFP expression in dependence on the concentration of liposome used (2 nM, 4 nM, 6 nM, 8 nM or 10 nM) to deliver 1 μg of GFP replicon to HEK293T cells 24 h after transfection.

