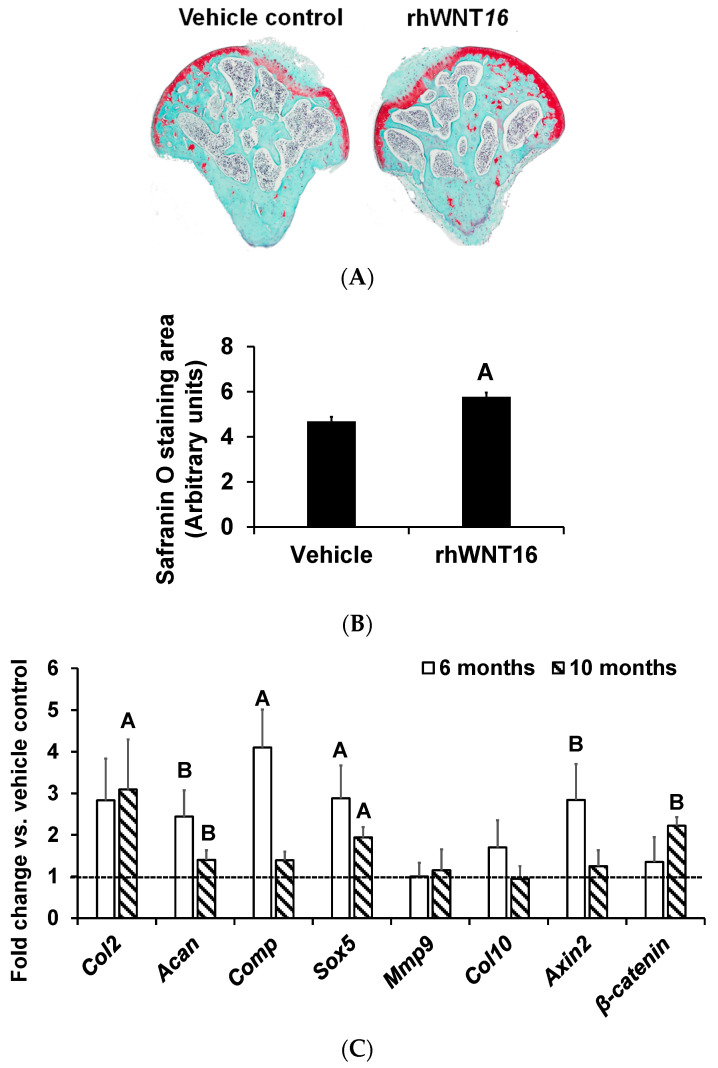
Figure 2.
Illustration of the femoral head safranin O staining and expression patterns of chondrocyte marker genes in ex vivo cultures of tibia epiphysis regions which contain articular cartilage. (A) Histology image of safranin O stained areas and (B) quantitation of safranin-O-stained areas in 6-month-old male femoral heads cultured ex vivo and treated with rhWNT16 vs. vehicle. (C) Quantitation of expression levels of genes from epiphyseal regions of the tibia with articular cartilage, isolated from 6- and 10-month-old male C57BL/6J mice and cultured ex vivo with 100 ng rhWNT16 vs. vehicle for 7 days in vitro. n = 5/group, values are the mean ± SEM, A p < 0.05 vs. vehicle and B p = 0.08 vs. vehicle.

