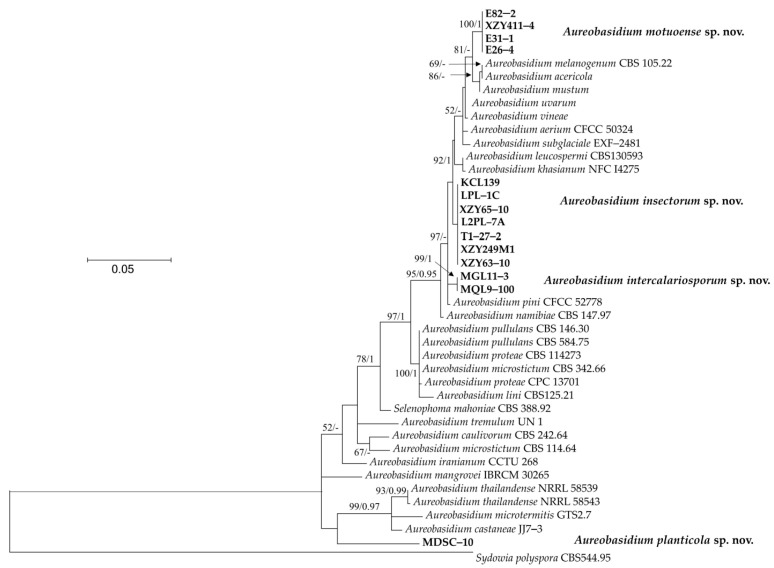
Figure 1.
The phylogenetic tree was inferred using the combined sequences of the ITS (including 5.8S rDNA) and LSU rDNA D1/D2 domains, depicting the phylogenetic positions of new taxa (in bold) within Aureobasidium. Bootstrap percentages of maximum likelihood analysis over 50% from 1000 bootstrap replicates and Bayesian inference higher than 0.9 (PP > 0.9) are shown on the deep and major branches. Bar = 0.05 substitutions per nucleotide position. Note: -, not supported (BP < 50% or PP < 0.9). The new taxa isolated in this study are shown in bold.

