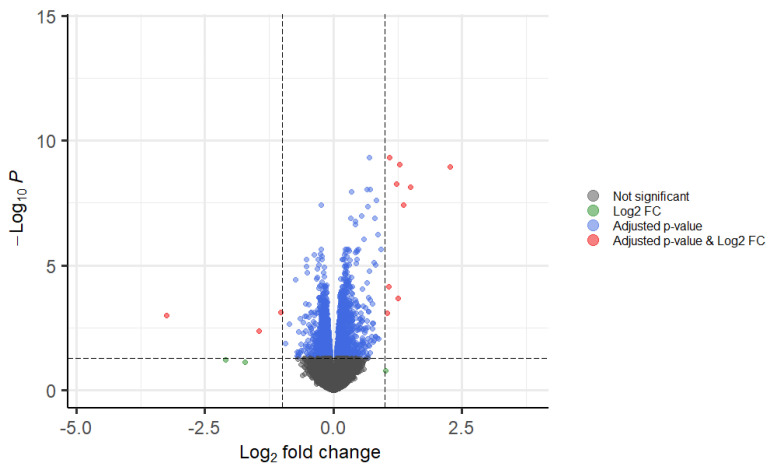
Figure 6.
Volcano plot from RNA sequencing analysis. Genes with significant modulation are visualized with a volcano plot, to show statistical significance (adjusted p-values) versus magnitude of change (fold-change). Genes in red have a corrected p-value less than 0.05 and a log fold-change greater than 1.

