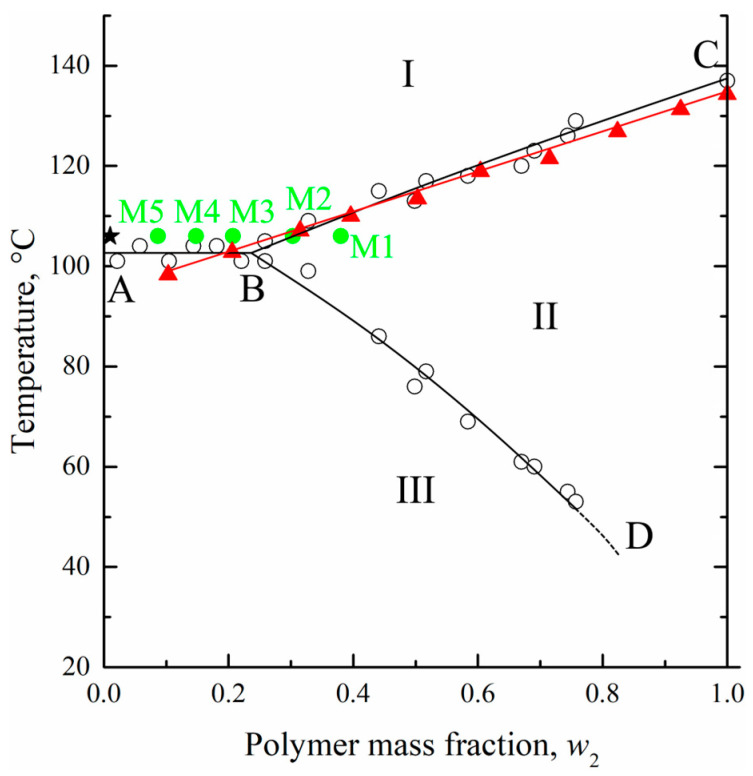
Figure 4.
The phase diagram for the HDPE–m-xylene mixture constructed by the optical method [27] (hollows circles and black curves) together with DSC data for the UHMWPE–o-xylene mixture (red triangles and curve). See explanation of star and green points in the text. Adapted with permission from L.N. Mizerovskii, T.N. Lebedeva, K.V. Pochivalov, Polymer Science Series A; Published by Springer-Nature, 2015.

