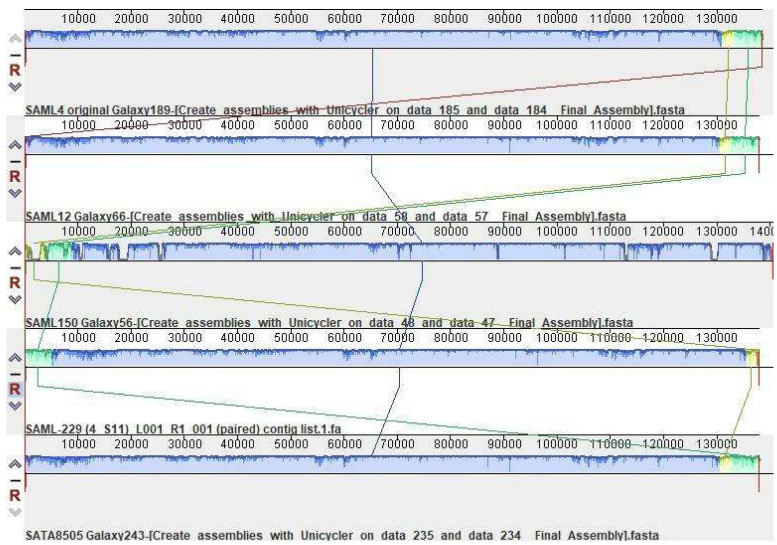
Figure 1.
Mauve comparative genomic sequence analysis of the five S. aureus phages included in StaphLyse™. This method aligns conserved regions in two or more genomes. The genomes of the five StaphLyse™ phages are lined up parallel to each other. The red vertical lines indicate the genome boundaries, which were determined using the genome assembly tool (defined by long terminal repeats, which are typical of the Herelleviridae family). Colored similarity plots are shown for each genome. Different colors represent different conserved regions within the genome. These regions are referred to as locally collinear blocks (LCBs). Similar colors with connecting lines show which regions are similar between the genomes. Shading and spacing within the LCB depict variation. In this figure, there are three LCBs, shown as blue, yellow, and green, shared among the five phage genomes [50].

