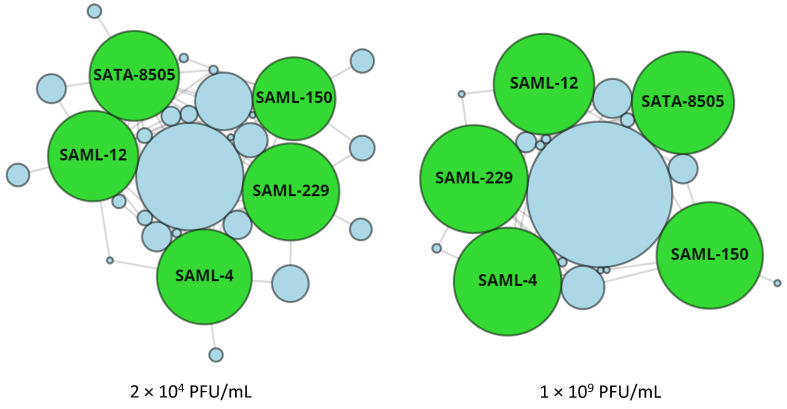
Figure 3.
Visualization of the lytic spectrum of StaphLyse™ at two concentrations. Shown is a force-directed graph depicting the host-killing range and interaction network of the 5 monophages included in StaphLyse™ generated by the proprietary PhageSelector™ program (Intralytix, Inc., Columbia, MD, USA). Monophages are represented by green nodes, which are sized based on the total strains each kills. Blue nodes are collections of S. aureus strains. Lines connecting green nodes to blue nodes indicate a monophage that is capable of lysing the strains from a node at a given concentration. Blue nodes that are larger in size and are clustered closer to the center of the figure indicate that a greater number of strains are being lysed by multiple phages (i.e., redundant lytic spectrum coverage), whereas smaller nodes that are clustered closer to the edges of the figure indicate that a smaller number of strains are susceptible to fewer monophages.

