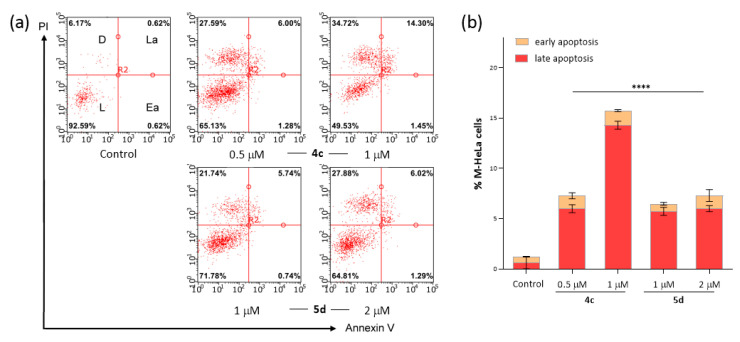
Figure 2.
Induction of apoptosis in M-HeLa cancer cells by compounds 4c and 5d, evaluated by Flow Cytometry Assay, after cell labeling with propidium iodide (PI) and Annexin V- Alexa Fluor 647 (a). L, D, La and Ea labels in the top right control plot correspond to Live, Dead, Late apoptosis and Early apoptosis, respectively. Cells were either unlabeled and untreated (Control) or treated with IC50 and IC50/2 doses of test compounds for 48 h, as indicated. The quantitative analysis of early and late apoptotic cells after drug exposure is represented in (b). Data are presented as mean ± error of the mean (n = 3). **** p ≤ 0.0001 compared to control (one-way ANOVA). Concentration for 4c was (IC50/2- 0.5 µM and IC50—1.0 µM); for 5d (IC50/2—1.0 µM and IC50—2.0 µM).

