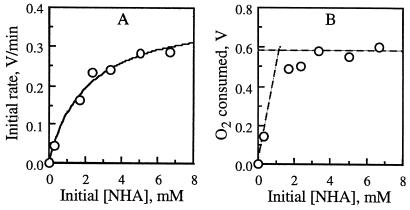
FIG. 3.
O2 consumption in RsL-catalyzed oxidation of NHA at pH 5.5. Plotted against the initial NHA concentration [NHA] are the initial O2 consumption rate (as the output voltage change rate) (A) and the final O2 consumed (as the final output voltage change) (B). For graph clarity, two sets of data, obtained with 0.05 and 0.3 mM NHA, are omitted from panel B. Their symbols overlap with those for 0 and 0.33 mM NHA (shown), and their values were included in the graph fitting. In panel A, the solid curve shows the fit to the Michaelis-Menten equation {v = −Vmax[NHA]/(Km + [NHA])} with a Km of 2.0 ± 0.5 mM and a Vmax of 0.39 ± 0.03 V min−1 or 0.19 ± 0.01 mM min−1 (corresponding to a kcat of 150 ± 10 min−1 (mean ± standard deviation). In panel B, the horizontal broken line represents the voltage change (0.58 ± 0.03 V, averaged over the data obtained with 3.3, 5.0, and 6.7 mM NHA) corresponding to maximal O2 consumption. Its cross point with the other broken line (voltage change, 0.5 × [NHA]; r2, 0.92), obtained by fitting the data obtained with 0, 0.05, 0.30, and 0.33 mM NHA, yielded a saturating [NHA] of 1.2 mM. By dividing 1.2 mM by 0.28 mM, the dissolved [O2] in water, we estimated an oxidation stoichiometry number of 4.1.

