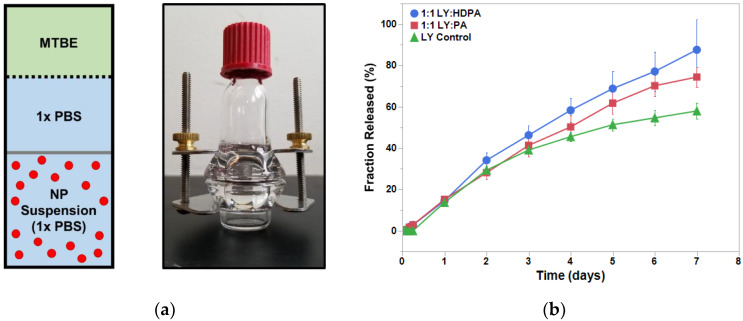
Figure 4.
LY294002 release in the presence of IPs. (a) Schematic and an image of the diffusion cell. The dialysis membrane (12–14 kDa MWCO) is represented by the gray bar and the dashed line represents the MTBE-PBS interface. (b) Results of the 1-week release study for the LY-only NPs (triangles), LY:PA NPs (squares), and LY:HDPA NPs (circles). MTBE— methyl tert-butyl ether.

