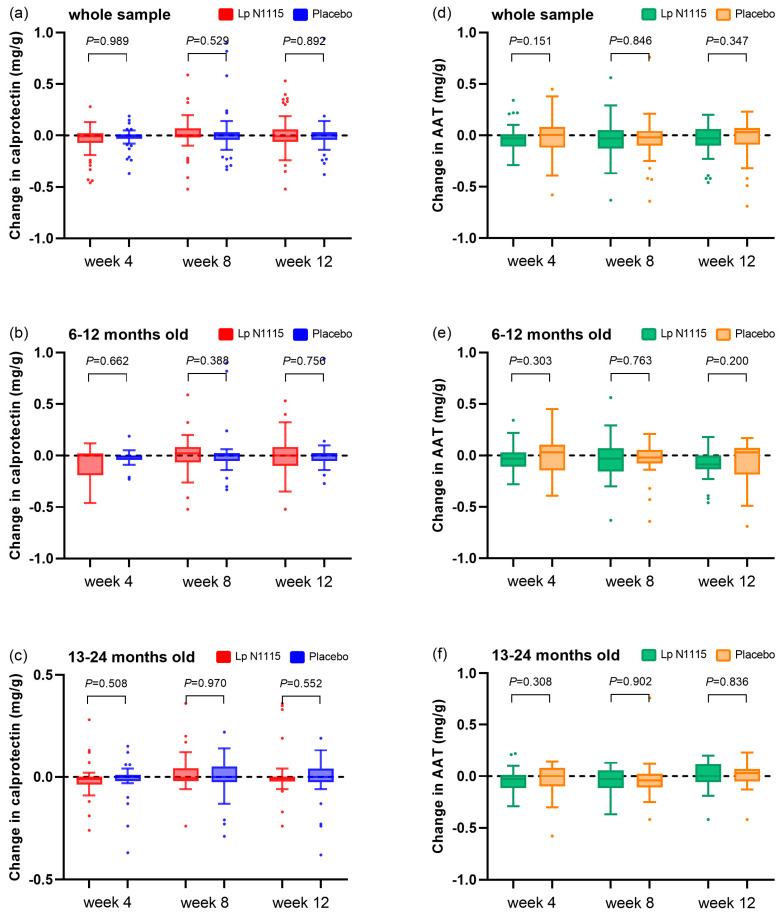
Figure 5.
Changes in FC and AAT compared with baseline. (a) FC changes of all participants; (b) FC changes of 6–12-month-old sub-group; (c) FC changes of 13–24-month-old subgroup; (d) AAT changes of all participants; (e) AAT changes of 6–12-month-old sub-group; (f) AAT changes of 13–24-month-old subgroup.

