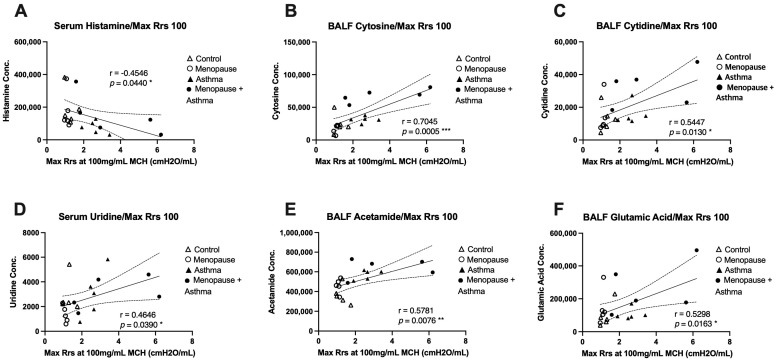
Figure 5.
Correlation plots of metabolites with total airway resistance (Rrs). Airway resistance from the 100mg/mL methacholine dose was assessed using the Flexivent system and association analysis performed for the most significantly different metabolites detected. (A) Serum histamine concentration with a negative correlation to Rrs, * p = 0.044. (B) BALF cytosine concentration with a positive correlation to Rrs, *** p = 0.0005. (C) BALF cytidine with a positive correlation to Rrs, * p = 0.013. (D) Serum uridine with a positive correlation with Rrs, * p = 0.039. (E) BALF acetamide with a positive correlation to Rrs, ** p = 0.0076. (F) BALF glutamic acid with a positive correlation to Rrs, * p = 0.0163. All statistical significance was achieved using Pearson’s correlation coefficient.

