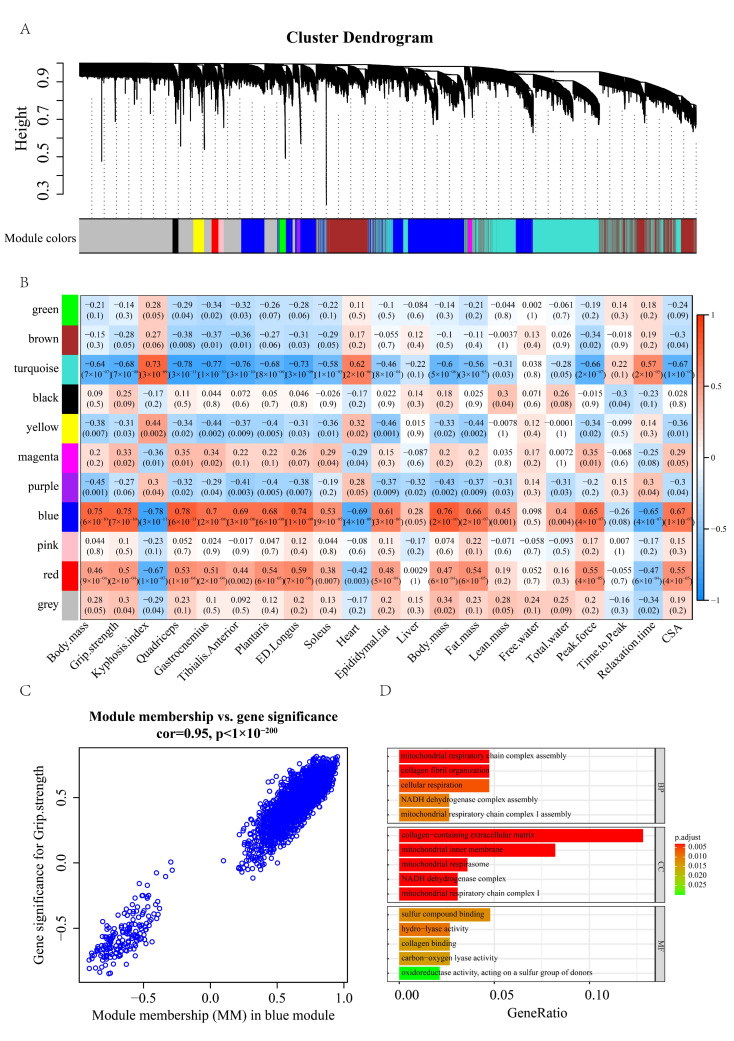
Figure 6.
(A) Cluster dendrogram of the 50 mouse samples in GSE145480. (B) Heatmap of the correlation between the module eigengenes and mouse phenotype. (C) Visualization of gene significance (GS) vs. module membership (MM) and gene expression levels of the green module. (D) Gene ontology enrichment analysis of the 43 significant genes (Section 2.4).

