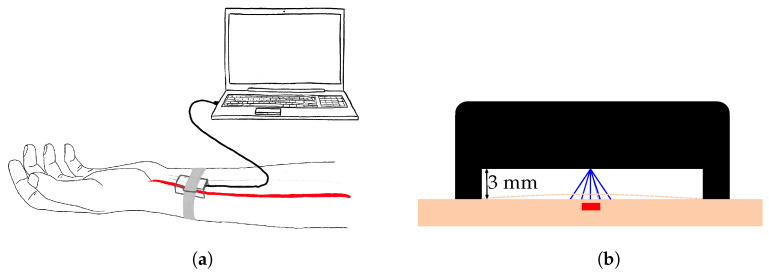
Figure 12.
Visualization of the radar setup for data collection. (a) Radar positioning at the left wrist, above the radial artery. Radar is inside a 3D printed enclosure and streams the collected radar data to the PC via standard USB connection. (b) Close up view of the radar positioning. The red square represents the radial artery. The radar is located in the 3D enclosure (represented in black), with a standoff of 3mm. The blue lines represent the reflected electromagnetic waves from different directions.

