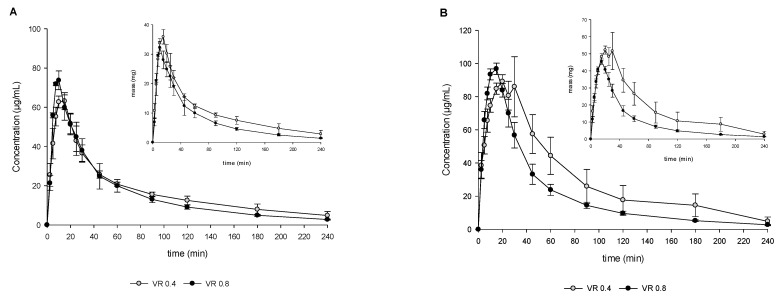
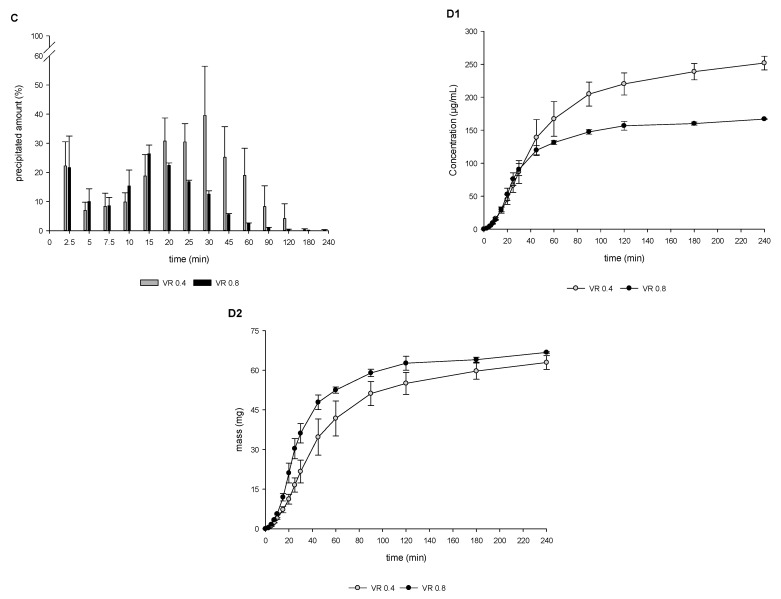
Figure 3.
Drug concentration profiles (dissolved, (A)), total amount profiles (dissolved and undissolved/precipitate, (B)), and undissolved/precipitated amount (C) obtained from the aqueous filtered and un-filtered phase; partitioning profiles ((D1) concentration/time vs. (D2) mass/time) obtained from the organic phase during in vitro DTPS experiments using VR of 0.4 vs. 0.8 and 75 mg IR tablet formulation. The precipitated mass/amount (Equations (1) and (4)) must be considered as solid mass/amount consisting of undissolved and precipitated API. Means ± SD, n = 3.


