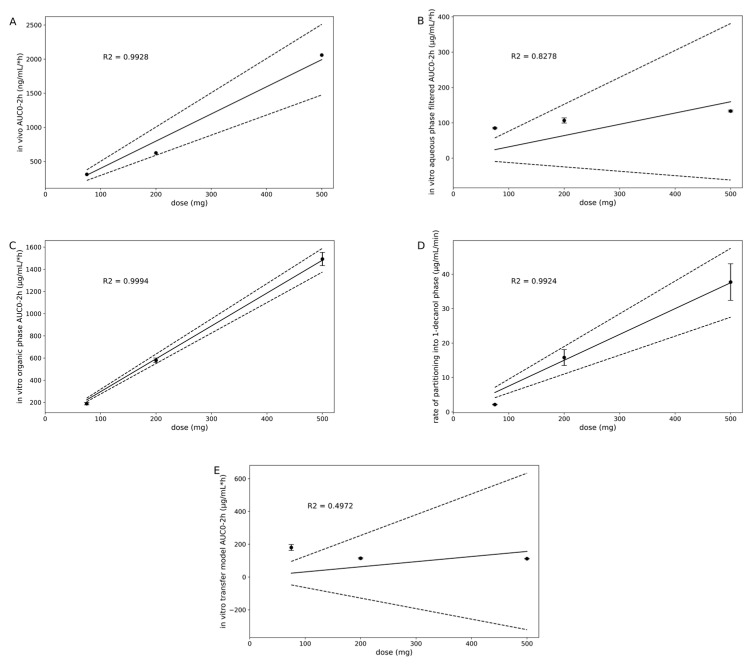
Figure 7.
In vivo area under the plasma concentration-time curve of 75, 200, and 500 mg MSC-A as OS during first 2 h ((A)); slope = 3.9849; p = 0.0036). In vitro aqueous phase ((B); slope = 0.3191; p = 0.0902) and organic phase ((C); slope = 2.9639; p = 0.0003) area under the drug concentration-time curve during first 2 h, and rate of linear partitioning into organic phase between 7.5 and 20 min ((D); slope = 0.075; p = 0.0038) during in vitro DTPS experiments using 75, 200, and 500 mg MSC-A as OS. In vitro transfer model area under the drug concentration-time curve data obtained from experiments using 75, 200, and 500 mg MSC-A as OS ((E); slope = 0.3122; p = 0.2949). Dashed lines represent the upper and lower 95% confidence interval. For (B,E), data were fitted via a linear regression model for consistency purposes only. For aqueous phase data and associated saturated concentrations, the analysis results in poor R2 and p values of slope applying a linear model.

