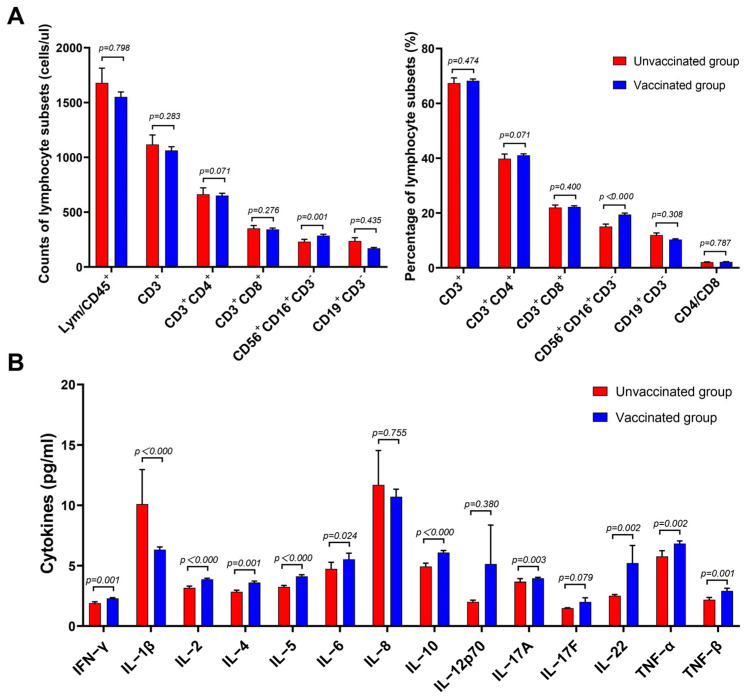
Figure 1.
Comparison of the lymphocyte subsets and cytokines between the unvaccinated and vaccinated groups. (A) Absolute numbers and percentage of lymphocyte subsets and the CD4+/CD8+ T-cell ratio. (B) Graphical representation of the concentrations of different cytokines in the unvaccinated and vaccinated groups. Unvaccinated group, n = 102; vaccinated group, n = 406. All p values were two-tailed, and differences with p < 0.05 were considered statistically significant. ns, not significant.

