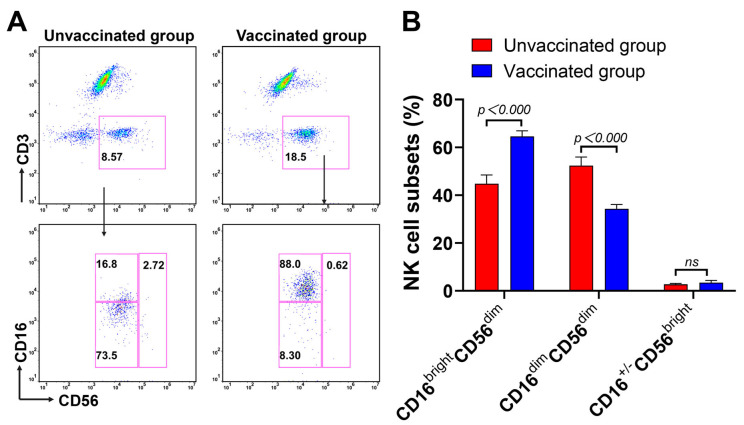
Figure 2.
Comparison of the NK cell subsets between the unvaccinated and vaccinated groups. (A) The expressions of CD16 and CD56 on NK cells were measured using flow cytometry. (B) Bar graph of the proportions of the NK cell subsets. Unvaccinated group, n = 96; vaccinated group, n = 347. All p-values were two-tailed, and differences with p < 0.05 were considered statistically significant. ns, not significant.

