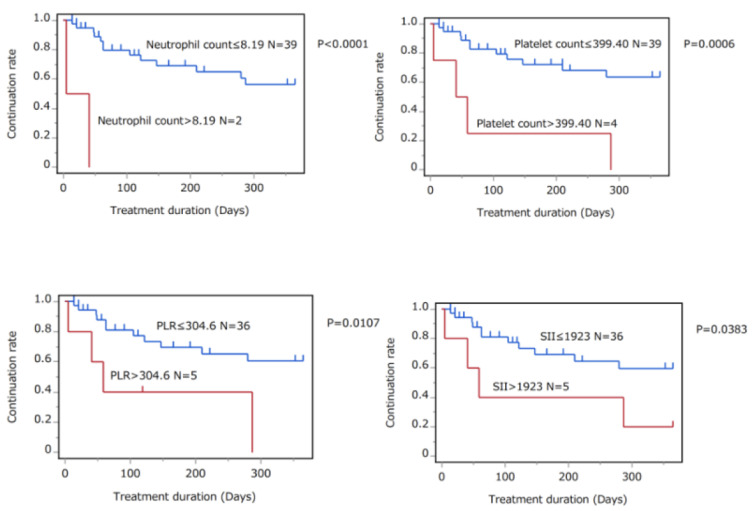
Figure 3.
Kaplan–Meier curves for treatment continuation rates of patients who received treatment with oral apremilast, methotrexate, cyclosporine, and etretinate. Patients were divided into two groups by pretreatment scores according to the cut-off values and determined by mean + 2SD levels of healthy controls (neutrophil counts; >8.19 × 10⁹/L, N = 2 and ≤8.19 × 10⁹/L, N = 39, platelet counts; >399.40 × 10⁹/L, N = 4 and ≤399.40, N = 39, PLR; >304.6, N = 5 and ≤304.6, N = 36, and SII; >1923, N = 5 and ≤1923, N = 36). The continuation rates of the two groups were compared by log-rank test.

