Figure 2.
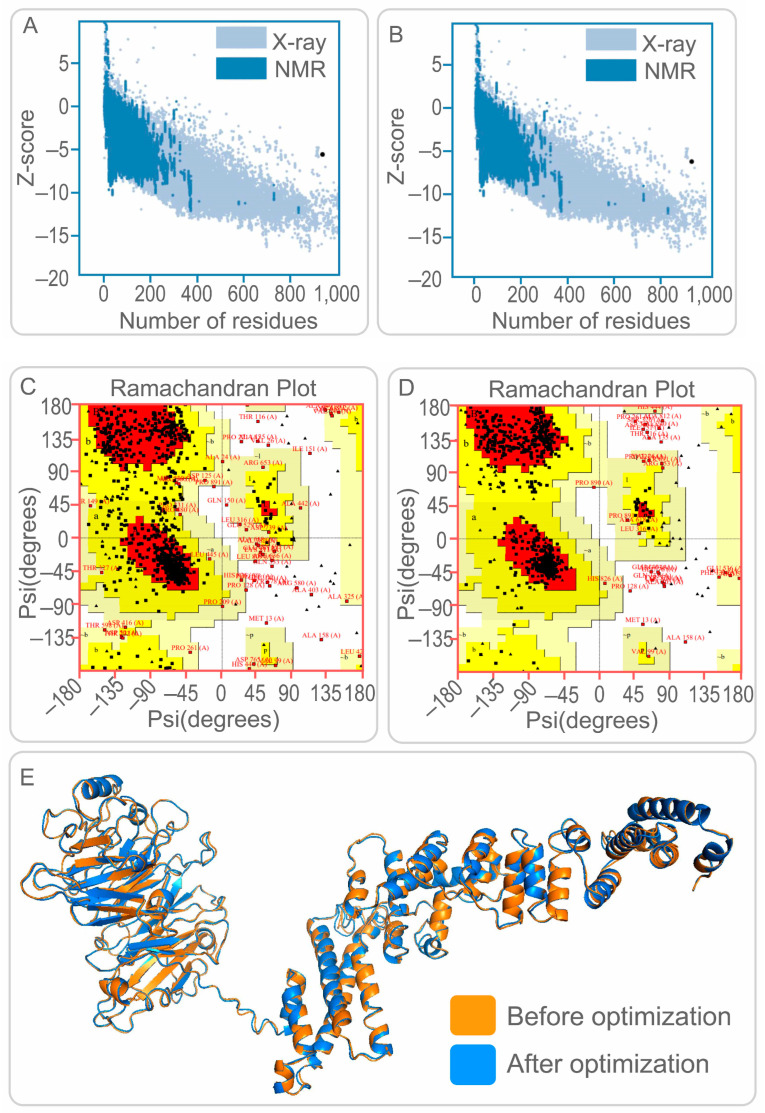
Construction and optimization of 3D models for PP19128R vaccine. (A,B) Z-score of the PP19128R vaccine predicted by ProSA web server. The Z-score of the 3D model of the PP19128R vaccine was −5.59 before optimization (A) and −6.28 after optimization (B). (C,D) Ramachandran plot of the PP19128R vaccine predicted by UCLA-DOE LAB-SAVES v6.0 server. The core, allow, gener, and disall of the PP19128R vaccine were 70.8%, 22.8%, 4.4%, and 2.0% before optimization (C) and 87.2%, 9.0%, 1.6%, and 2.2% after optimization (D). (E) The 3D structure of the PP19128R vaccine was constructed by the I-TASSER server and optimized by the Galaxy Refine server. Before optimization: orange; after optimization: blue.

