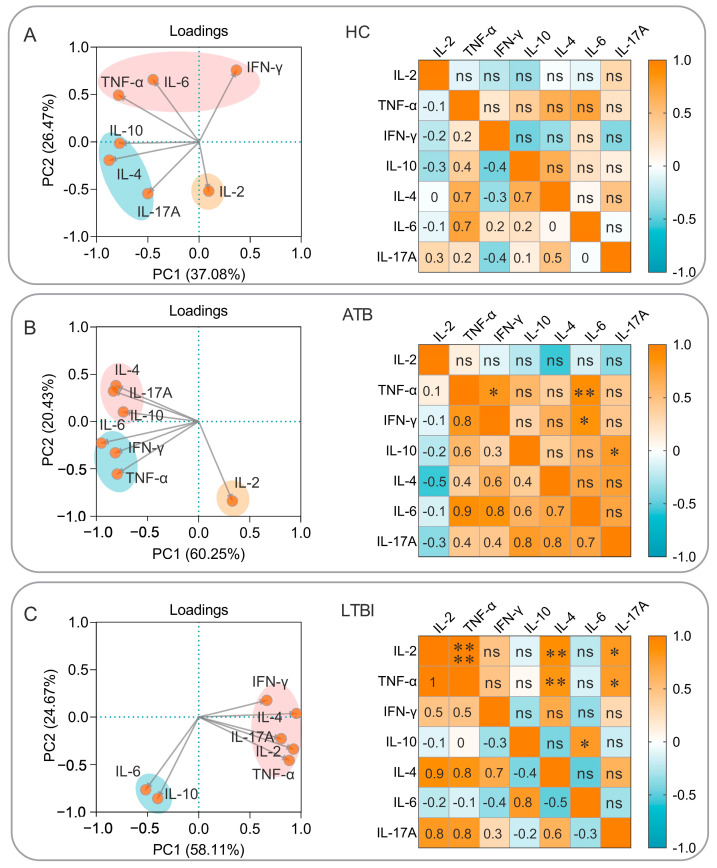
Figure 11.
Principal component analysis (PCA) and correlation analysis. The purified PP19128R vaccine was used to stimulate PBMCs obtained from HCs (A), ATB patients (B), and individuals with LTBI (C). PCA and correlation analysis were performed to analyze the potential effects among cytokines using GraphPad Prism 9.5.1 software. The PCA analysis selected PCs with eigenvalues greater than 1.0 (“Kaiser rule”) as the component selection method. The proportions of variance for PC1 and PC2 are plotted on the x-axis and y-axis, respectively. The correlation analysis used Pearson’s R to determine the relationship between two cytokines, and R values of −1 to 1 are shown in blue to orange, respectively. *, p < 0.05, **, p < 0.01, ****, p < 0.0001; ns, no significant difference.

