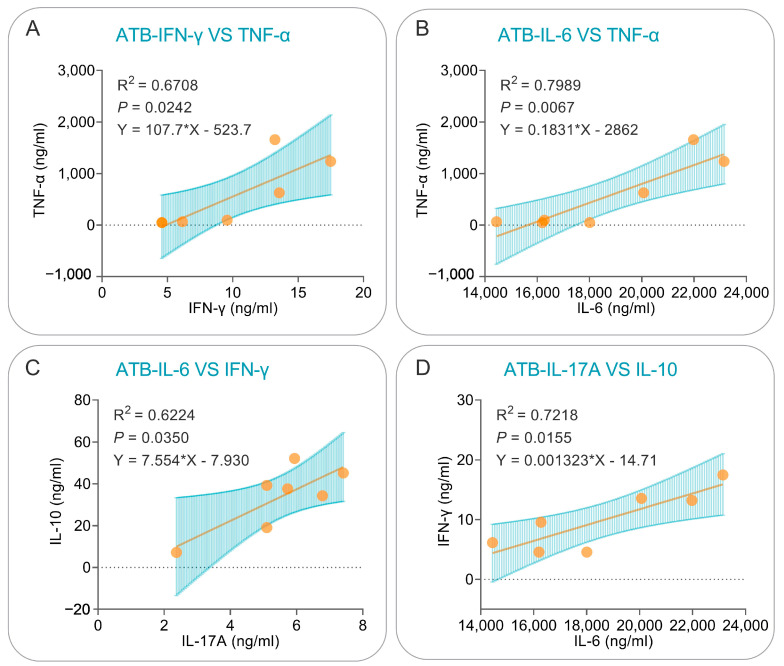
Figure 13.
Simple linear regression analysis of cytokines in the ATB population. Correlations for IFN-γ vs. TNF-α (A), IL-6 vs. TNF-α (B), IL-6 vs. IFN-γ (C), and IL-17A vs. IL-10 (D) were analyzed using simple linear regression in GraphPad Prism 9.5.1 software. The R-squared values for the goodness of fit, p values, and equations are shown in each panel. A p value lower than 0.05 was considered significant.

