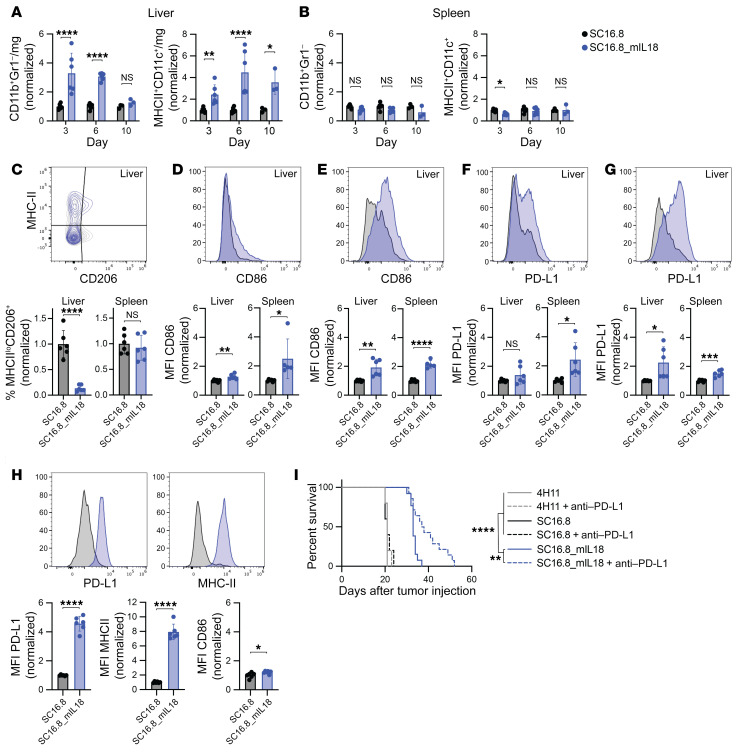
Figure 4. IL-18 recruits and reprograms myeloid cells in the tumor microenvironment.
(A and B) Levels of CD11b+Gr1– macrophages and MHC-II+CD11c+ dendritic cells detected (A) in the liver TME and (B) in the spleen 3, 6, and 10 days after CAR T cell treatment. *P < 0.05, **P < 0.01, ****P < 0.0001 (2-way ANOVA). (C–H) Representative flow plots and quantification on day 6 after CAR T cell administration. See Supplemental Figure 3 for quantification on day 3, 6, and 10. *P < 0.05, **P < 0.01, ***P < 0.001, ****P < 0.0001 (Student’s t test). (C) Levels of CD206+MHC-IIlo M2-like macrophages. (D and E) Expression of activation marker CD86 on (D) macrophages and (E) dendritic cells in liver TME and spleen. (F and G) Expression of checkpoint molecule PD-L1 on (F) macrophages and (G) dendritic cells in liver TME and spleen. (H) Expression of PD-L1, MHC-II, and CD86 on F4/80+ macrophages in the liver TME. (I) Survival of mice with metastatic mSCLC that received 2 × 10⁶ CAR T cells on day 7 and 250 μg anti–PD-L1 antibody on days 14, 17, and 20. **P < 0.01, ****P < 0.0001 (log-rank test, n = 5 for 4H11 and SC16.8, n = 14 for SC16.8_mIL18).

