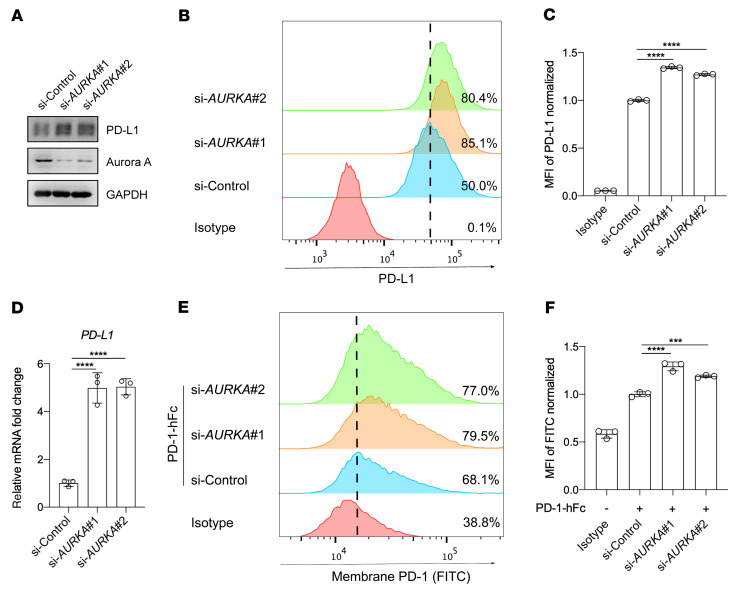
Figure 2. Knockdown of AURKA elevates PD-L1 expression in tumor cells.
(A) Western blot analysis of the expression of indicated proteins following treatment with an AURKA siRNA or a control siRNA. (B) Flow cytometric analysis of surface expression of PD-L1 on BxPC3 cells after treatment with the indicated siRNA. (C) Normalized MFI for the data shown in B (n = 3). (D) qRT-PCR analysis of PDL1 expression in BxPC3 cells after treatment with the indicated siRNA (n = 3). (E) Flow cytometric analysis of cell-surface PD-1 binding of BxPC3 cells after treatment with the indicated siRNAs. (F) Normalized MFI for the data in E (n = 3). Data indicate the mean ± SD. ***P < 0.001 and ****P < 0.0001, by 1-way ANOVA.

