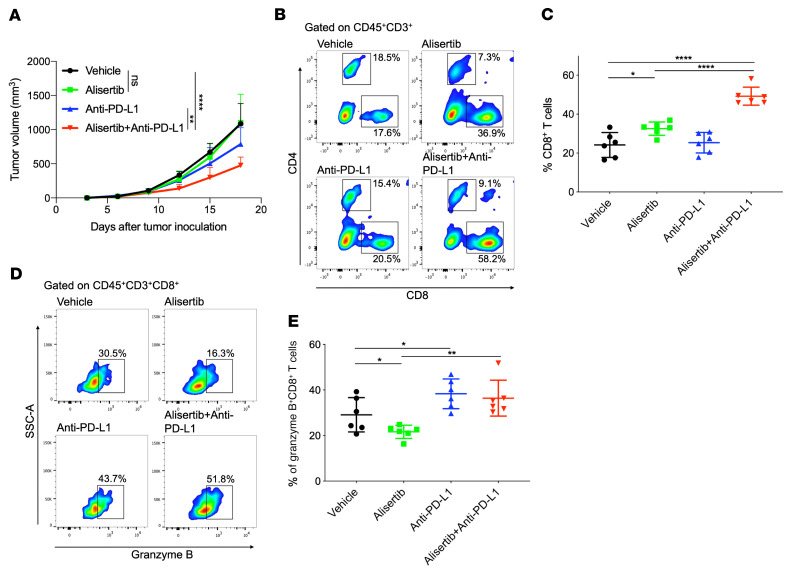
Figure 6. PD-L1 blockade therapy improves the antitumor activity of alisertib.
(A–E) BALB/c mice were inoculated with CT26 cells and administered alisertib, anti–PD-L1 antibody alone, or their combination. (A) Tumor growth curves of CT26 in BALB/c mice. Tumor volumes were measured at the indicated time points (n = 6). (B and D) Flow cytometric analysis of tumor-infiltrating CD8+ T cells (B) and granzyme B+CD8+ T cells (D). Representative plots are shown. (C and E) Cumulative data for B and D (n = 6). Data indicate the mean ± SD. A 2-way ANOVA was applied to compare time-dependent tumor growth. *P < 0.05, **P < 0.01, and ****P < 0.0001, by unpaired t test.

