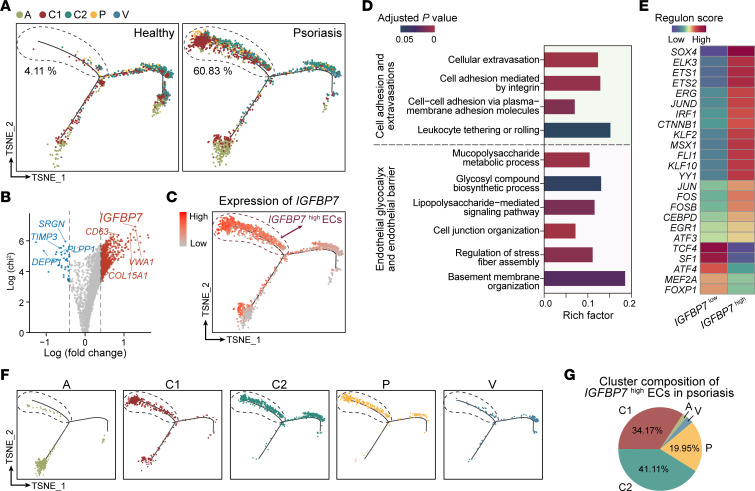
Figure 4. IGFBP7hi ECs are increased in psoriatic skin.
(A) Pseudotime trajectory of healthy and psoriatic ECs. (B) Volcano plot of DEGs between the psoriatic ECs (circled by dashed line) and the rest of the psoriatic ECs (see A right panel). Genes with log (fold change) > 0 are upregulated in psoriatic ECs (circled by dashed line). (C) IGFBP7 expression in psoriatic ECs. (D) GO analysis showing the pathways enriched in psoriatic IGFBP7hi ECs compared with psoriatic IGFBP7lo ECs. The x axis represents the rich factor. Bar colors indicate adjusted P value. (E) Regulon activity of IGFBP7hi and IGFBP7lo ECs. (F) Pseudotime trajectory of each cluster from psoriatic ECs. (G) Cluster composition of psoriatic IGFBP7hi ECs.

