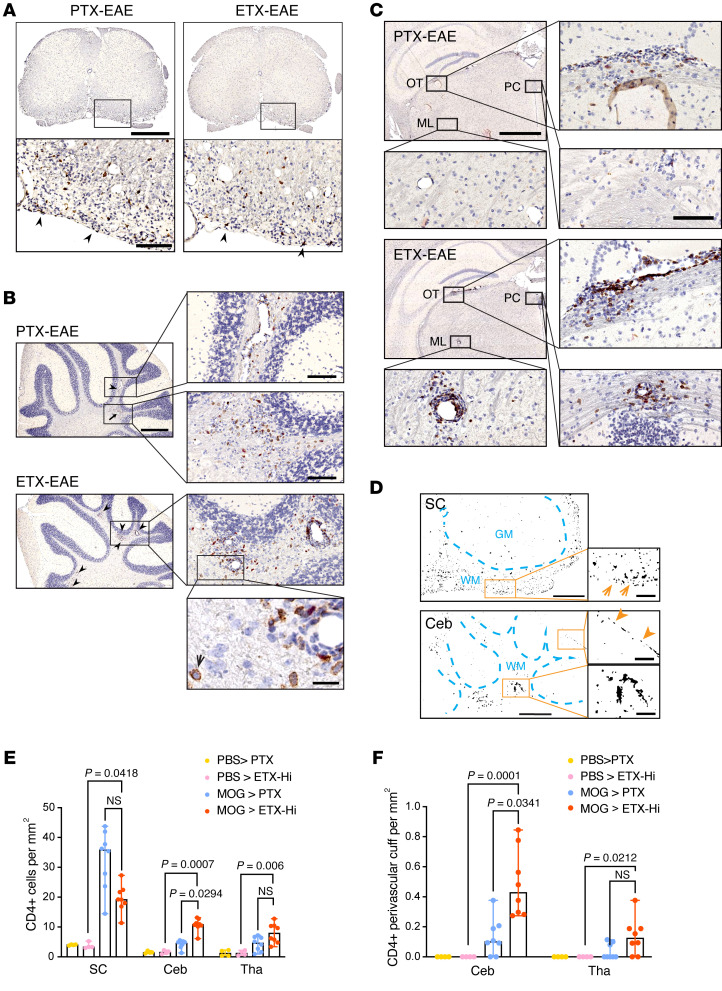
Figure 6. ETX-EAE mice show increased CD4+ lymphocyte infiltration in the cerebellum and thalamus compared with PTX-EAE.
Sections from mice sacrificed at day 30 after immunization with CFA/MOG35-55 followed by ETX (ETX-EAE) or PTX (PTX-EAE) injection were immunostained with anti-CD4 antibody (brown) and counter-stained with hematoxylin (purple). (A–C) Representative CD4 staining in spinal cord (A), cerebellum (B) and thalamus (C). In ETX-EAE mice, CD4+ cells were found in perivascular cuffs and surrounding parenchyma indicated by arrowheads and shown in boxed regions of B and C. CD4+ cells from PTX-EAE mice were localized to perivascular space or scattered (arrowhead and arrow). Boxed regions shown at higher magnifications to illustrate morphological details. A high magnification micrograph (bottom panel in B) depicts CD4+ staining (black arrow). OT, optic tracts; ML, medial lemniscus; PC, posterior commissure. (D) ImageJ-generated binary drawings on CD4+ distribution in the white matter (WM) of a PTX-EAE spinal cord (SC, orange arrows) and ETX-EAE cerebellum (Ceb). In Ceb, orange arrowheads indicate CD4+ cells confined to a single layer in the meninges (upper boxed region). Perivascular localization of CD4+ cells shown at a higher magnification in the cerebellum of ETX-EAE mice (lower boxed region). GM, gray matter. Scale bars: 1 mm (top row A, and left column B), 2 mm (top and third rows in left column in C), 200 μm (high magnification of boxed regions A–C), 500 μm (D, left column), 100 μm (D, right column), and 50 μm (B, bottom right panel). (E and F) Quantification of number of CD4+ cells (E) and CD4+ perivascular cuffs (F) in indicated CNS regions. Data represent median ± range; Kruscal-Wallis test (nonparametric). NS, not significant. n = 4 and 8 mice for controls (PBS > PTX; PBS > ETX-Hi) and EAE groups (MOG > PTX; MOG > ETX-Hi), respectively. Similar results were obtained from 2 independent experiments.

