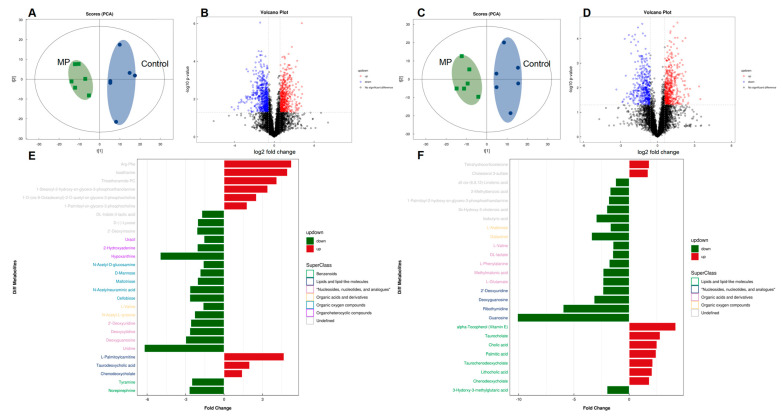
Figure 4.
Comparisons of metabolite profiles (n = 6). Volcano plots represent distribution of metabolite fingerprints in positive (A) and negative (C) ion modes. PCA score charts of metabolite profiles in positive (B) and negative (D) ion modes. Fold change and classification of identified metabolites under positive (E) and negative (F) ion modes.

