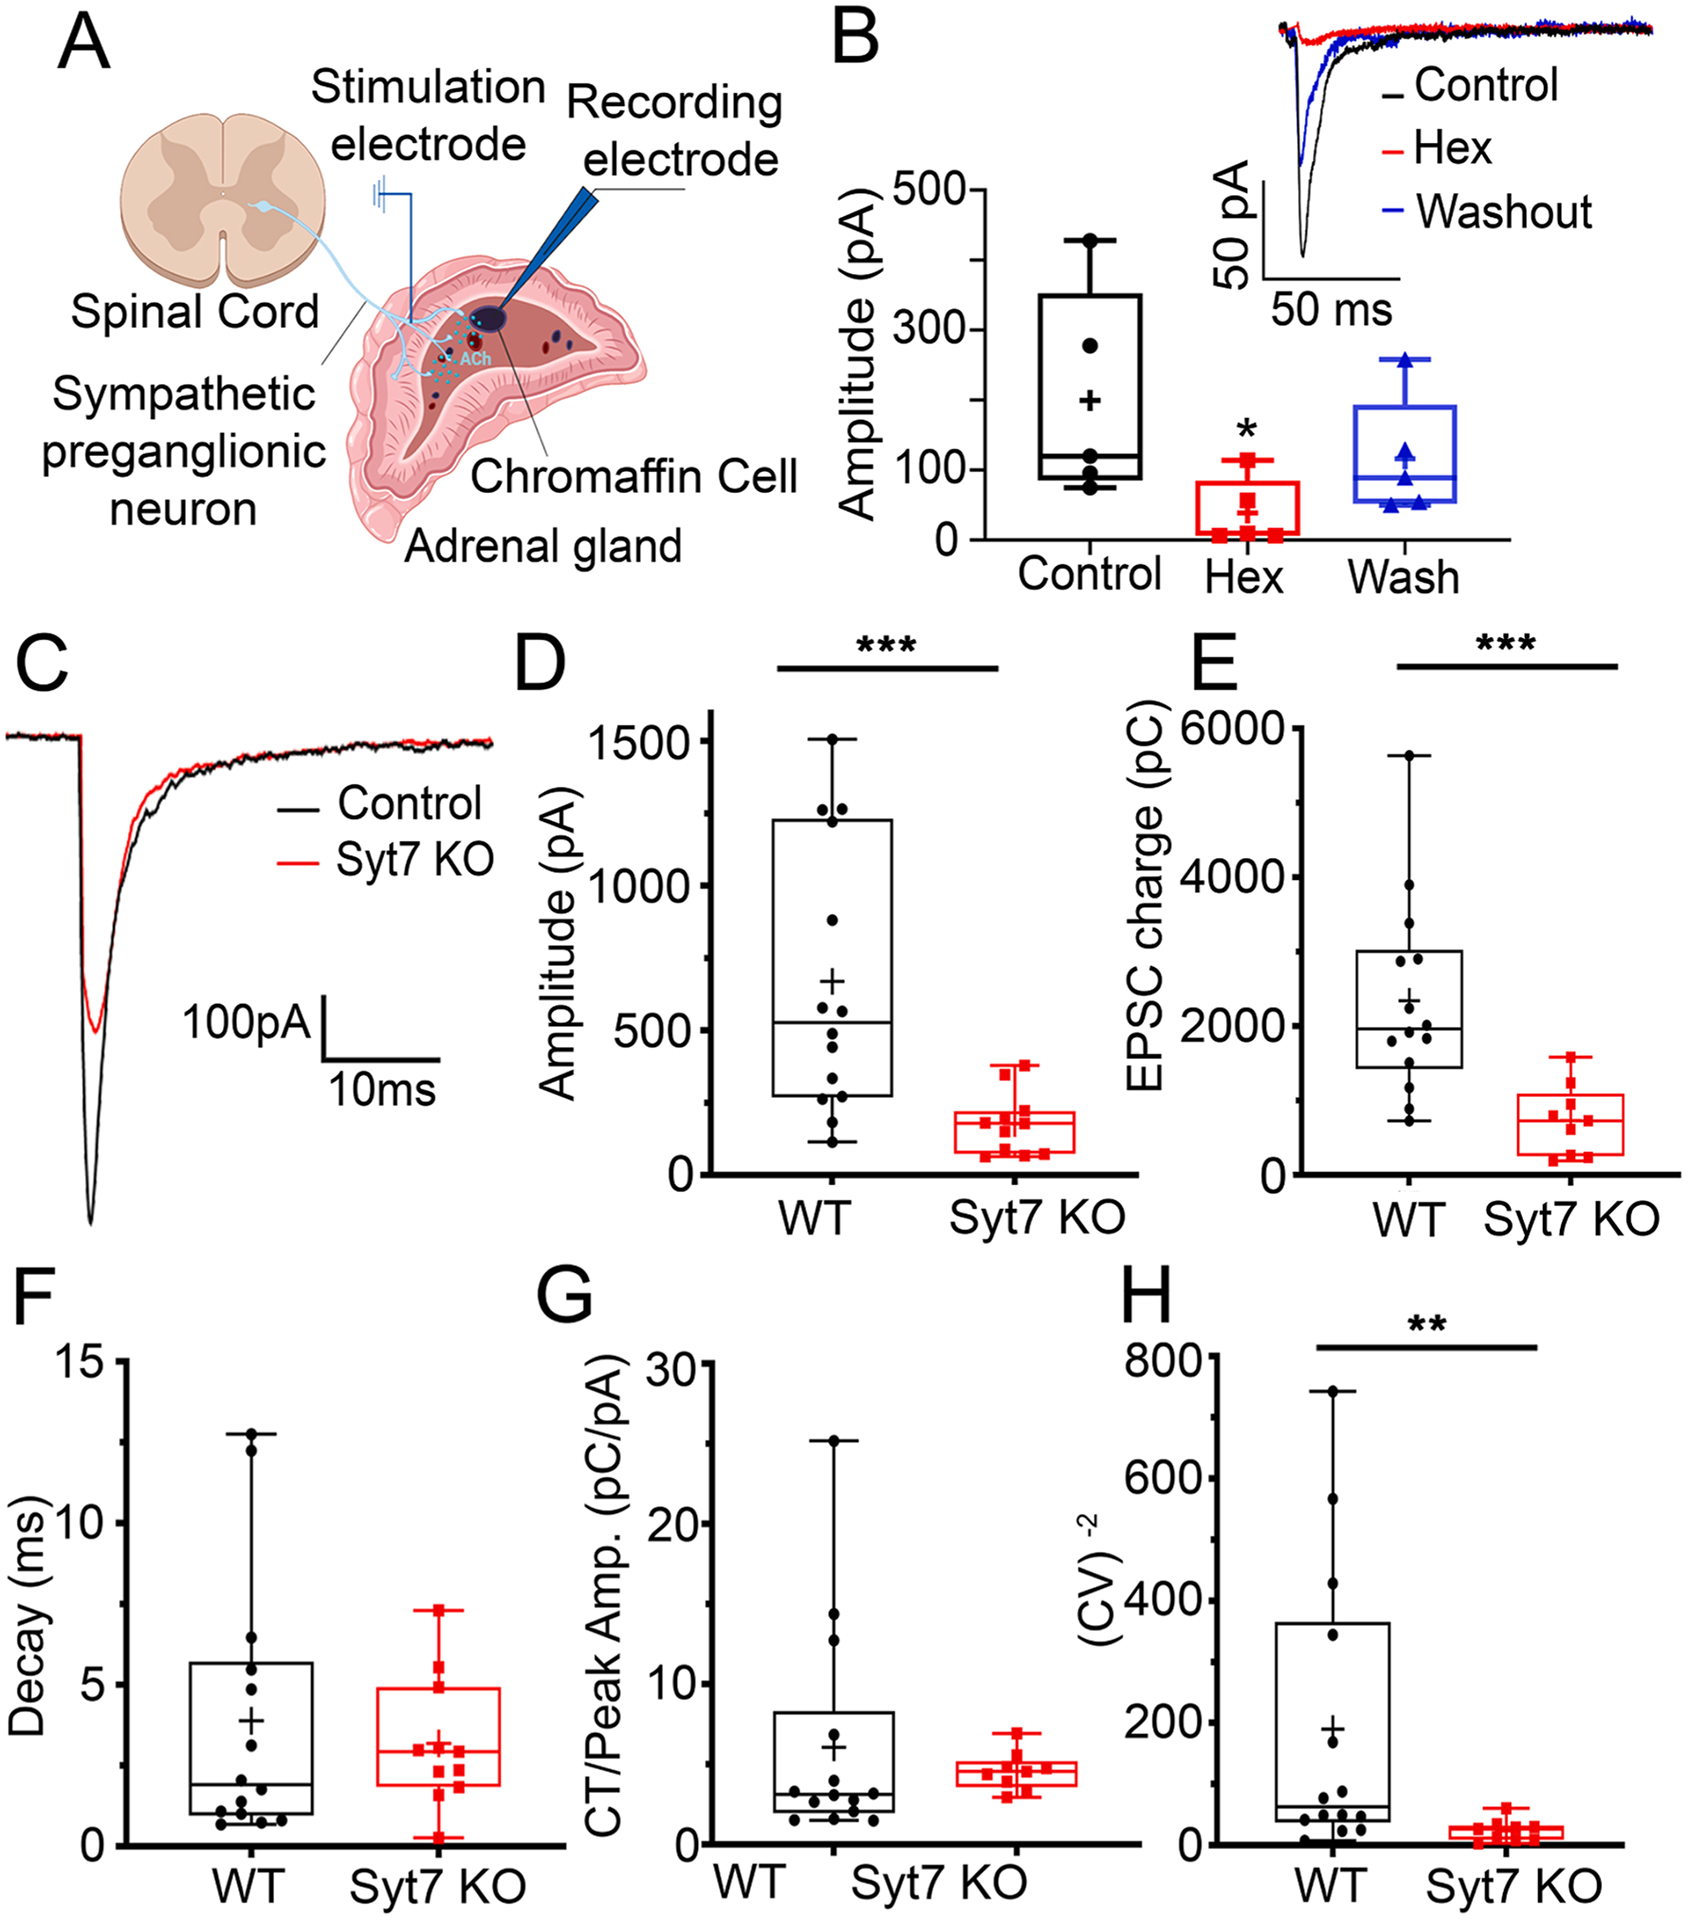
Fig. 1. Comparison of evoked EPSCs in WT and Syt7 KO synapses.

EPSCs were evoked by stimulating preganglionic input to the adrenal medulla with a bipolar stimulating electrode. Models created with BioRender (https://www.biorender.com). B. EPSCs recorded in a chromaffin cell evoked by stimulating the preganglionic nerve terminals (black) were blocked by the cholinergic antagonist hexamethonium (red), and recovered during washout (blue), *p = 0.032, Kruskal-Wallis, Dunn’s multiple comparisons (n = 5 slices; 3 independent preps). Representative EPSCs at WT synapses: Control (black), during block by Hexamethonium (Hex, red), and after Washout (blue) (inset). C. EPSCs recorded in chromaffin cells by stimulating the WT (black) and Syt7 KO (red) preganglionic nerve terminals. D. Averaged peak amplitudes of evoked EPSCs from Syt7 KO (red) are decreased compared to WT (black). ***p < 0.001, Mann Whitney test (n = 14 wt and n = 9 KO slices; > 6 independent preps). E. Average EPSC charge transfer from Syt7 KO (red) mice are decreased compared to WT (black) mice. ***p < 0.001, Mann Whitney test (n = 14 wt and n = 9 KO slices; > 6 independent preps) F. Average decay time constants of evoked EPSCs in chromaffin cells after stimulation of WT (black) and Syt7 KO (red) axons. p = ns, Mann Whitney test (n = 14 wt and n = 9 KO slices; >6 independent preps). G. Charge transfer normalized to peak EPSC amplitude from evoked EPSCs are not different in WT (black) mice compared to Syt7 KO (red) mice. p = ns, Mann Whitney test (n = 14 wt and n = 9 KO slices; >6 independent preps). H. CV−2 of the EPSC amplitude was significantly greater in chromaffin cells from WT (black) compared to Syt7 KO (red) mice. **p < 0.05, Mann Whitney test (n = 14 wt and n = 9 KO slices; > 6 independent preps, those records were obtained at 2 mM external calcium).
