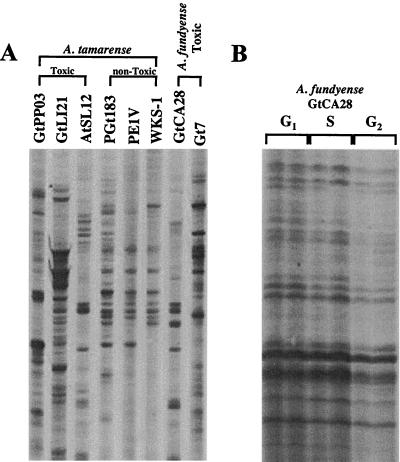
FIG. 2.
Comparison of inter- and intraspecific DD analysis of dinoflagellates. (A) Three toxic strains of A. tamarense, three nontoxic strains of A. tamarense, and two toxic strains of A. fundyense were compared. The inter- and intrageneric variabilities were high. (The image is a composite of lanes from one gel rearranged for clarity.) (B) Three different cell cycle stages in synchronized cultures of A. fundyense (GtCA28) were analyzed. In contrast to what was seen in panel A, the patterns were identical and hence allowed the identification of differentially expressed bands (Fig. 4).

